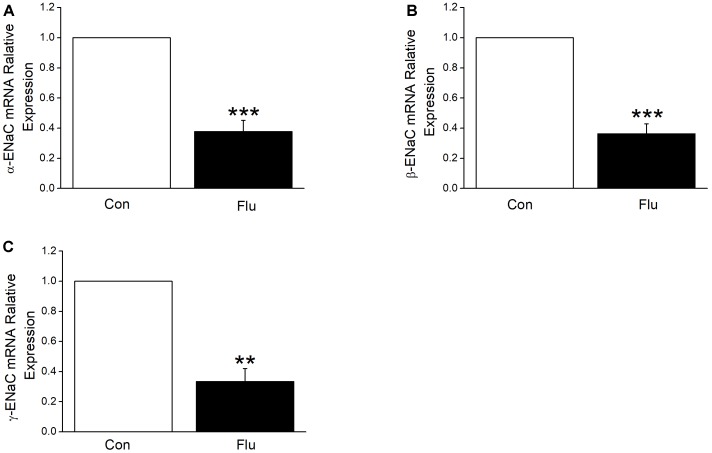
FIGURE 4.
Influenza virus decreased the transcriptional expression of ENaC. The mRNA samples were isolated from MTECs infected with influenza virus (Flu) for 24 h. Relative levels of mRNA were calculated as α- or β- or γ-ENaC/GAPDH ratios. (A–C) Quantitive-real-time PCR results for α-, β-, and γ-ENaC mRNAs. ∗∗P < 0.01, ∗∗∗P < 0.001, compared with control (Con), n = 4–5. Data was presented as mean ± SE Student’s t-test was used to analyze the difference of the means for significance in (A,B), and Mann–Whitney test was used to analyze the difference of the means for significance in (C).

