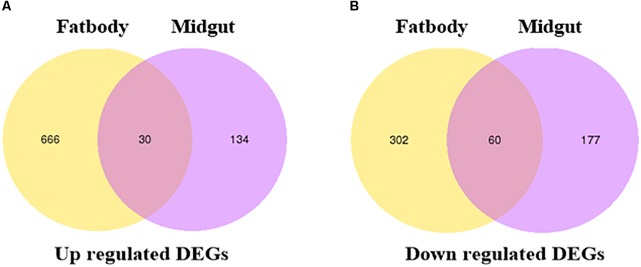
FIGURE 3.
Venn diagram illustrating the differentially expressed genes. (A) Venn diagram of upregulated DEGs in the fat bodies and midguts of S. litura subjected to tomatine treatment. (B) Venn diagram of downregulated DEGs in the fat bodies and midguts of S. litura subjected to tomatine treatment. The q-values in multiple tests were adjusted to control the false discovery rate (FDR). We used “fold changes ≥ 1 and q < 0.005” as the threshold to assess differentially expressed genes between the TOM treatment and control groups.

