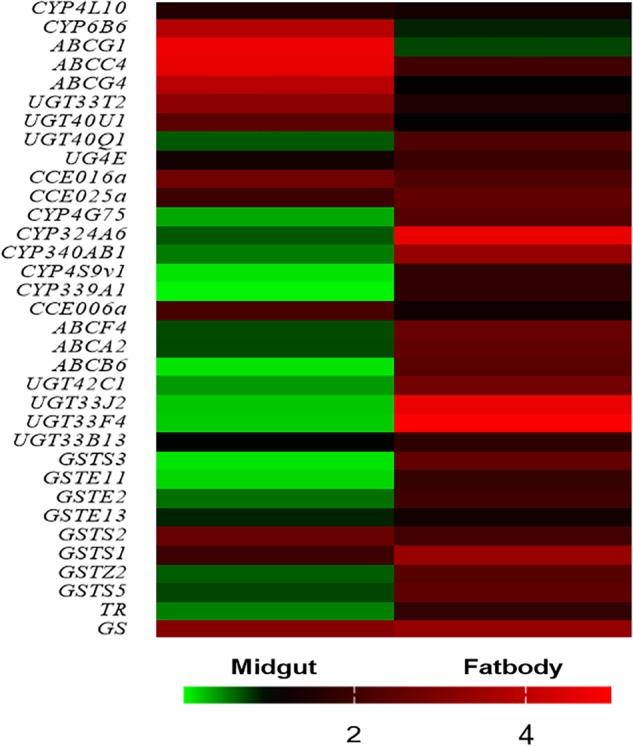
FIGURE 4.

Biological (independent) qRT-PCR validation of the RNA-Seq data. The first 11 genes are highly expressed in the midgut when exposure to tomatine (TOM), and the latter 23 genes are highly expressed in fat bodies when exposure to TOM. The bar represents the scale of the expression levels of TOM treatment/Control. The red, black, and green bar indicates mRNA expression levels of TOM treatment are higher, similar or lower than the control groups, respectively. The detailed fold change and p value were shown in Supplementary Table S2.
