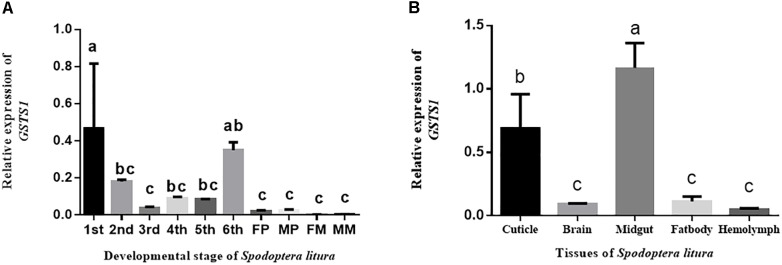
FIGURE 5.
The qRT-PCR analysis of GSTS1 expression in various S. litura tissues and life stages. (A) Relative spatial expression of GSTS1; the different life stages include 2-day-old 1st, 2nd, 3rd, 4th, 5th, and 6th (last) instar larvae, pupae, and adults. (B) Relative temporal expression of GSTS1; the different tissues include the cuticle, brain, midgut, fat body, and hemolymph. The different letters on the error bars indicate significant differences (p < 0.05, Duncan’s multiple range test) among the developmental stages and tissues.

