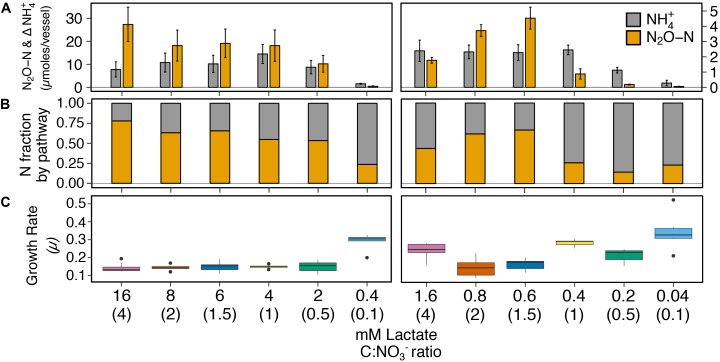
FIGURE 2.
The effects of high resource (left; range of lactate concentrations with 12 mM NO3−) and low resource (right; range of lactate concentrations with 1.2 mM NO3−) concentrations with the same C:NO3− ratio on pathway selection in I. calvum C5. (A) Production of N2O-N and net change of NH4+ over a 100-h incubation period at 30°C. Each bar represents the average of 8–10 replicates per treatment (Supplementary Table S2). (B) Fraction of dissimilated N by pathway. (C) Growth rates for each corresponding treatment. The x-axis label defines lactate concentration and C:NO3− ratio in parentheses.

