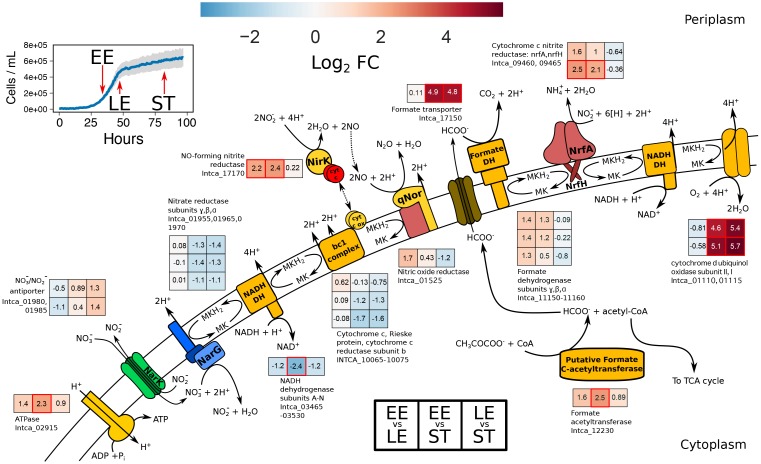
FIGURE 4.
Metabolic reconstruction of the ETC from I. calvum with transcriptional changes for genes participating in dual-pathway dissimilatory nitrite reduction. Sampling points for transcriptomic profiling are shown on the inset growth curve with red arrows for each respective growth phases. Log2 fold changes in transcript abundance are shown for late exponential relative to early exponential growth phase (EE vs. LE), stationary phase relative to early exponential growth phase (EE vs. ST), and stationary phase relative to late exponential growth phase (LE vs. ST). Locus IDs for each gene product correspond to heat map subplots in the order shown (left-to-right for each growth phase and top-to-bottom for each locus ID specified). Higher transcript abundance is represented in red, lower transcript abundance in blue, and no change in transcript abundance in white. Significant changes in transcript abundance (p < 0.01) are marked as a red box. Value of log2 fold change is specified within each subplot. The log2 fold changes of 14 NADH dehydrogenase subunits (Intca_03465-03530) were averaged as transcriptional changes were all shifted in the same direction.

