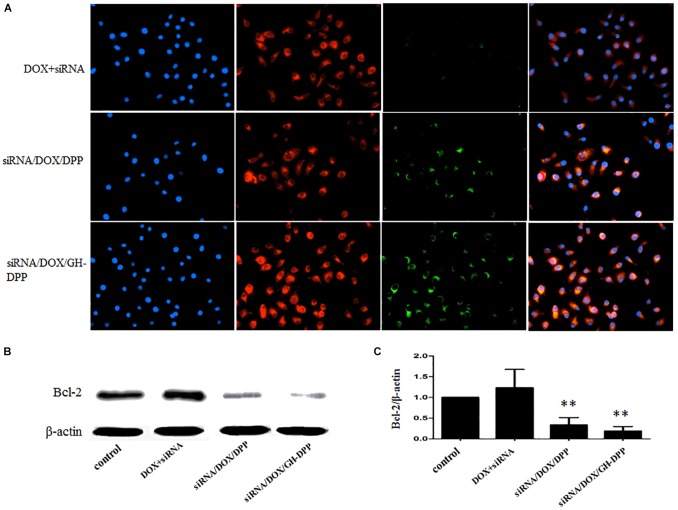
FIGURE 6.
Cellular uptake and western blot analyses. (A) The images of HepG2 cells treated with mixture of free DOX and FITC-labeled siRNA, siRNA/DOX/DPP or siRNA/DOX/GH-DPP nanoparticles for 4 h, respectively. FITC channel (green) for FITC-labeled siRNA, TRITC channel (red) for DOX, and DAPI channel (blue) for nucleus were presented simultaneously. (B,C) Protein expression of BCL-2 evaluated by western blot analysis with different treatments. ∗∗P < 0.01 vs. control.

