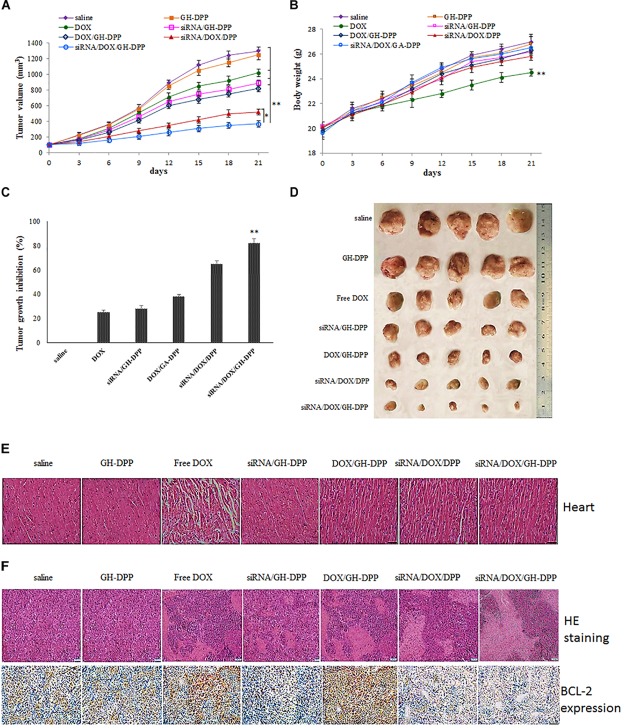
FIGURE 8.
Inhibition of tumor growth by injection of physiological saline (control), blank GH-DPP nanoparticles, free DOX, siRNA/DPP, DOX/DPP, siRNA/DOX/DPP or siRNA/DOX/GH-DPP nanoparticles, respectively. (A) Tumor growth curves; (B) Body weight changes; (C) The tumor growth inhibition rate; (D) excised tumors of each group; (E) Histological observation of heart for H22 tumor-bearing mice treated with different drug formulations; (F) The histological features of H22 subcutaneous tumor sections are characterized by H and E and BCL-2 immunohistochemical analysis. The data represent the mean of the tumor volume or body weight from five mice ± SD; ∗P < 0.05 and ∗∗P < 0.01.

