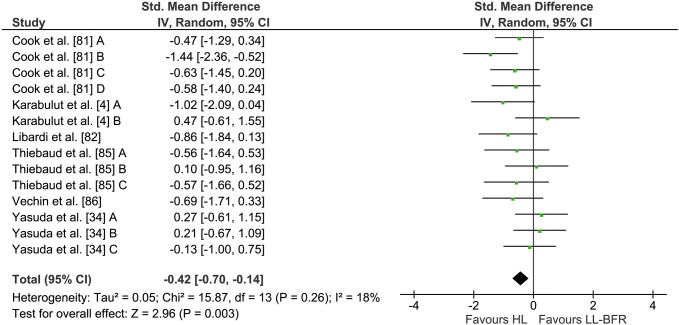
Fig. 2.
Forest plot demonstrating the effects of LL-BFR versus HL training on muscular strength. Different letters for the same study represent different muscular strength assessment methods. CI confidence interval, HL high-load, IV inverse variance, LL-BFR low-load blood flow restriction, Random random effects model

