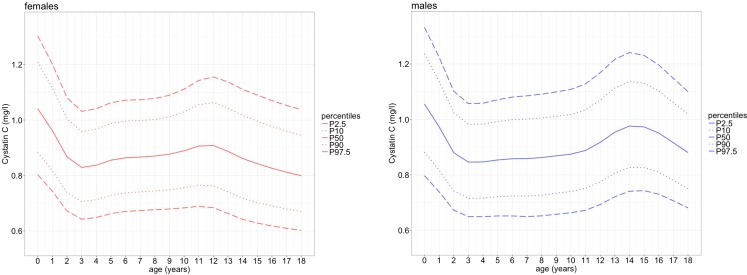
Fig. 3.
Percentiles of cystatin C and its effector variable age for 0- to 18-year-old children of the LIFE Child cohort. Solid line = 50th percentile, dotted line = 10th and 90th percentile, dashed line = 2.5th and 97.5th percentile. P percentile. The percentiles were calculated using the ChildSDS package [37]. Note that just before the age of 12 years, the curves diverge and show different patterns for males and females thereafter. n = 6217 observations in 2803 participants

