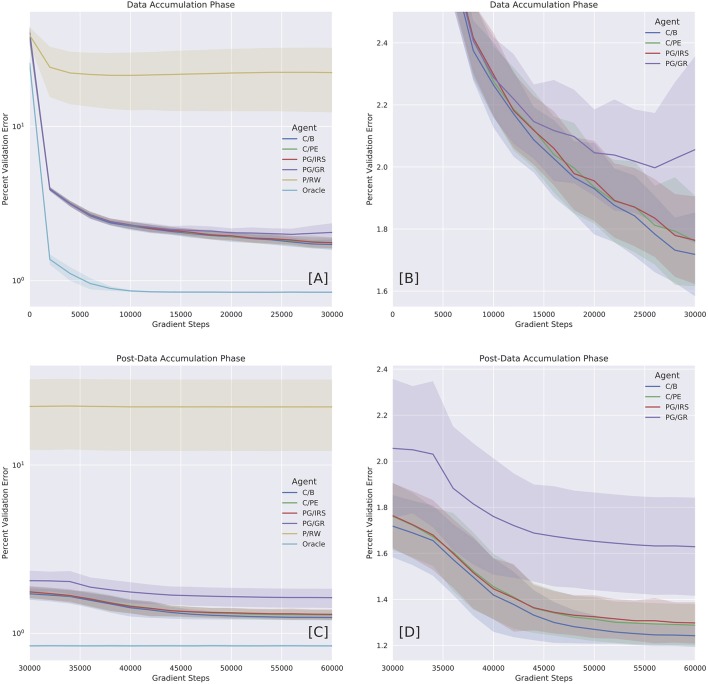
Figure 4.
Benchmarking model variants with oracle dataset. Performances were reported in error percentage (also, see Table 2). (A) Performance as a function of time during Data Accumulation Phase (DAP). (B) Close-up on curious variants (C/B, C/PE, and PG/IRS), as well as policy gradients (PG/GR) informed by surrogate reward statistics. The C/PE and PG/IRS variants performed similarly, but differed significantly from C/B (Table 2). (C) Performance over time during post-DAP. (D) Close-up on post-DAP performances for curious variants and PG/GR.

