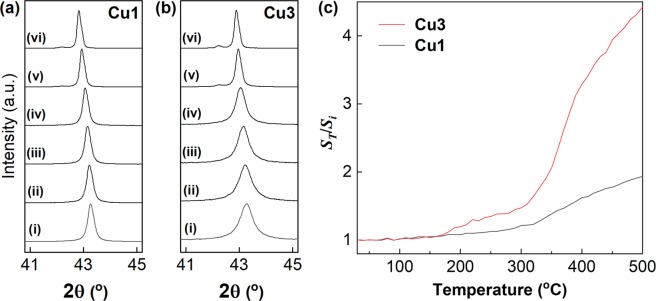
Figure 3.
Sintering behavior of the copper NPs. (a) Change in the copper (111) XRD peak of Cu1 (i) before heating; after heating at (ii) 100 °C, (iii) 200 °C, (iv) 300 °C, (v) 400 °C, and (iv) 500 °C. (b) The behavior of Cu3. The shift to lower angles with heating, which was observed for (a,b), is due to the thermal expansion of the crystal lattice of copper. (c) Relationship between ST/Si and the sintering temperature (T) of Cu1 and Cu3. ST/Si: crystallite size ratio at T (ST: Cs at T).

