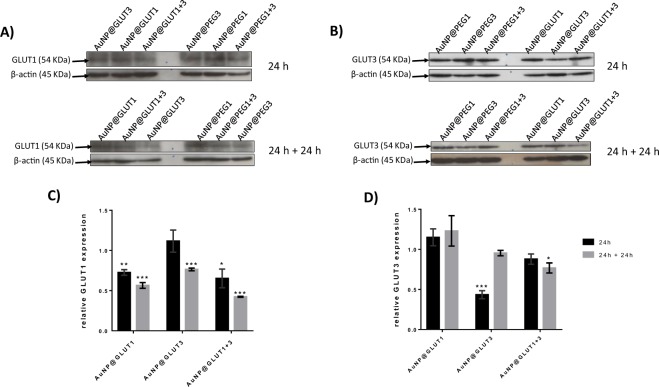
Figure 4.
(A) Western Blot analysis of GLUT1 and β-actin proteins. (B) Western Blot analysis of GLUT3 and β-actin proteins. Represented Western Blots correspond to 10 µg total protein of MKN-28 cells grown on 24 well plates and incubated for 24 h with fresh RPMI medium supplemented with 5.5 mM fructose and 0.75 nM AuNP@PEG1, 0.63 nM AuNP@PEG3, 1.38 nM AuNP@PEG1 + 3, 30 nM AuNP@GLUT1, 20 nM AuNP@GLUT3, or a mixture of AuNP@GLUT1 + 3. After this 24 h period, cells were incubated for an additional 24 h with fresh medium supplemented according to the first incubation. (C) GLUT1 relative intensity values normalized to corresponding intensity of β-actin protein and to the corresponding AuNP@PEG control sample. (D) GLUT3 relative intensity values normalized to corresponding intensity of β-actin protein and to the corresponding AuNP@PEG control sample. Error bars represents SEM of at least three independent experiments. The grey line on the border of blots represent the place where images were cropped. Full length blot images can be found on Supplementary Fig. S2. *p-value < 0.5, **p-value < 0.005, ***p-value < 0.0005.

