Fig. 4.

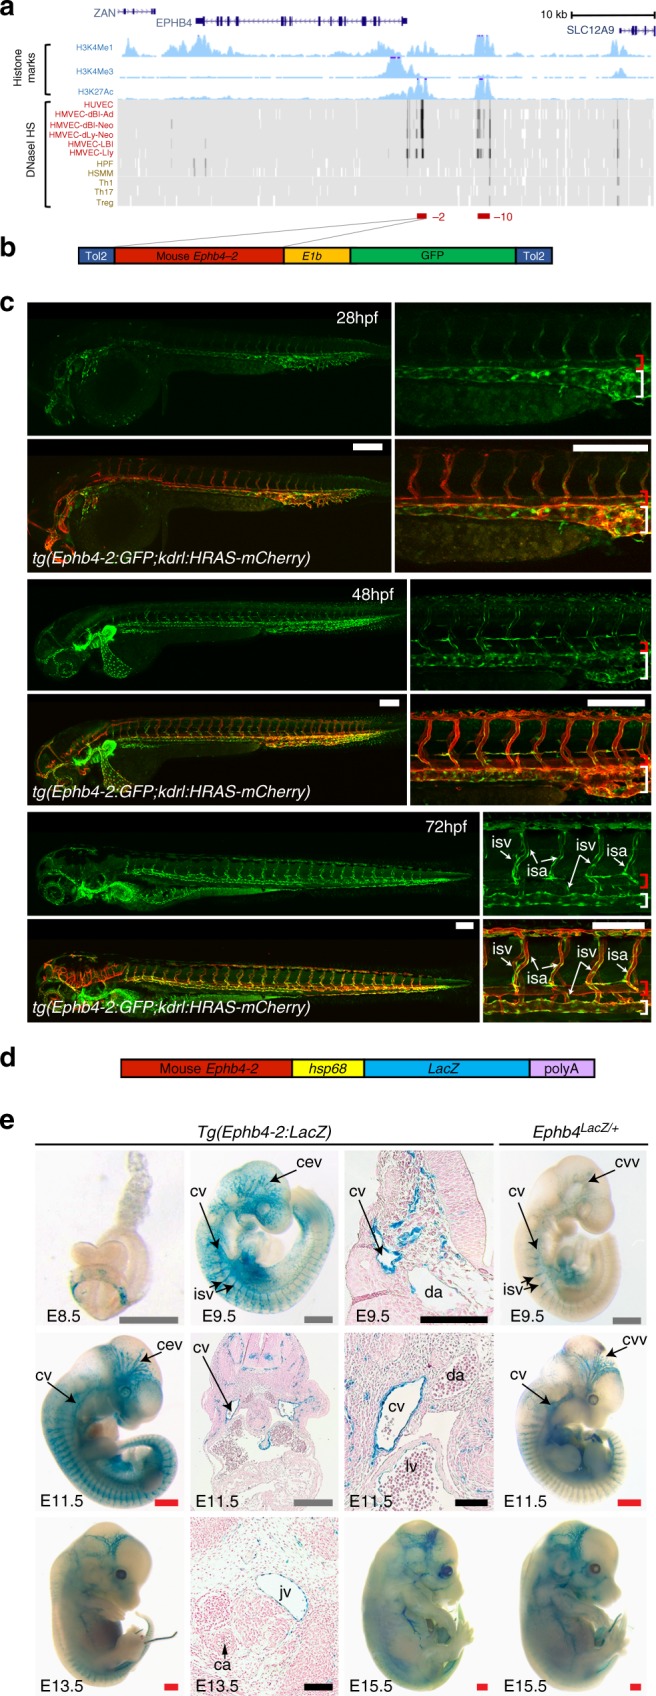
The vein-specific Ephb4-2 enhancer recapitulates endogenous Ephb4 expression in fish and mouse. a Region around the human EPHB4 gene as seen on UCSC Browser (http://genome.ucsc.edu). Within histone marks, the three tracks show the enhancer-associated H3K4Me1 and H3K27Ac and promoter-associated H3K4Me3 marks found in human umbilical vein endothelial cells as light blue peaks. Within DNaseI hypersensitivity, the heat maps show DNaseI hypersensitive (HS) regions found in different cell lines, with endothelial cells labelled in red and non-endothelial cells labelled in orange. The endothelial histone marks and endothelial-specific DNase I hypersensitivity indicate two potential endothelial enhancer regions (named -2 and -10, marked as red horizontal lines). b, c The Tol2 Ephb4-2:E1b:GFP transgene (b) directs venous expression of the green fluorescent protein (GFP) reporter gene in a transgenic zebrafish line also expressing the pan-endothelial kdrl:HRAS-mCherry (c). No enhancer activity (as detected by GFP expression) was seen in the dorsal aorta, whereas robust activity was detected in the cardinal and ventral veins. Expression is detected in all intersegmental vessels. White scale bars are 100 μm. Red bracket = dorsal artery; white bracket = axial veins; isv = intersegmental vein. d, e The Ephb4-2:hsp68:LacZ transgene (d) directs vein-specific expression of the LacZ reporter gene in transgenic mice (e) as compared to Ephb4LacZ/+. Black scale bars are 100 μm, grey scale bars are 500 μm, red scale bars are 1000 μm. isv = intersomitic vessel, cv = cardinal vein, da = dorsal aorta, jv = jugular vein, ca = carotid artery, ccv = common cardinal vein, cev = branches of the cerebral venous plexus, lv = left ventricle. See also Supplementary Figure 4
