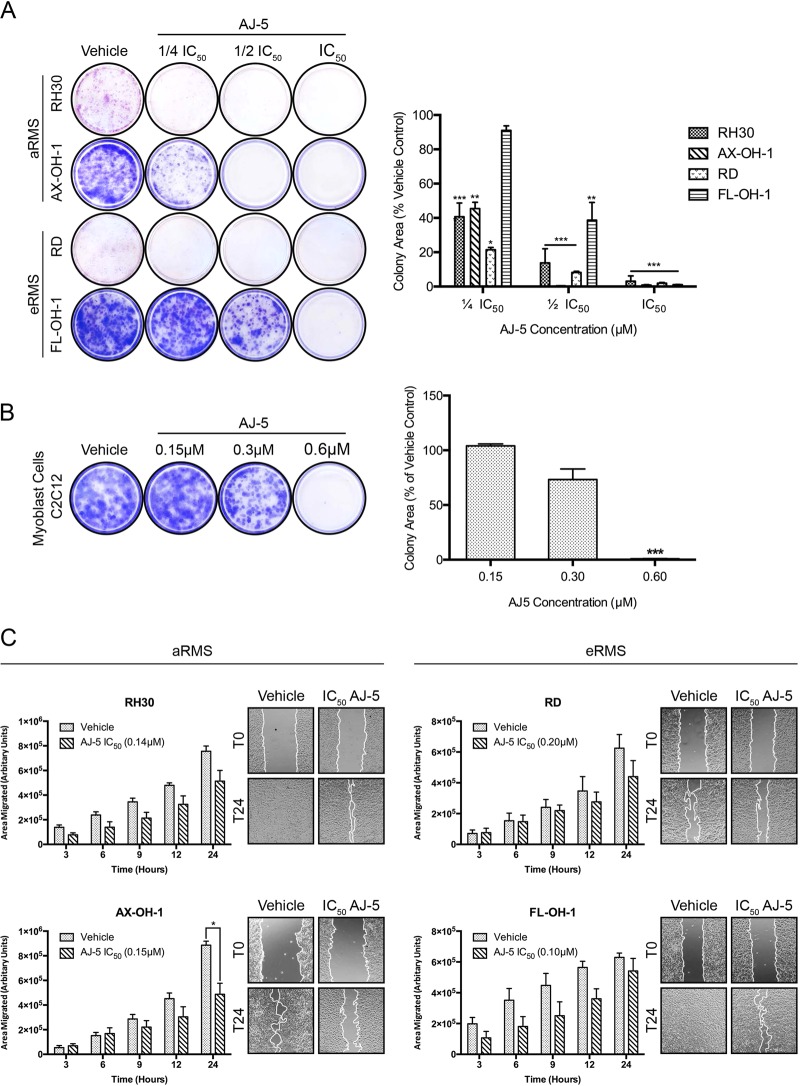
Fig. 2. AJ-5 inhibits the ability of RMS cells to survive, proliferate and migrate.
a Representative images and quantification of clonogenic assays of eRMS and aRMS cells treated with vehicle, ¼ IC50, ½ IC50 or IC50 concentrations of AJ-5 for 24 h and then replated at low densities in drug-free medium and left for 7–21 days for colonies to form. Colonies were stained with crystal violet and images from three independent repeats were quantified using the ImageJ plugin ColonyArea. The graph represents the mean colony area ± SEM of each treatment condition as a percentage of the vehicle control. b The same as a above for the non-malignant mouse myoblast cell line C2C12, but treated with vehicle, 0.15 µM, 0.3 µM, or 0.6 µM AJ-5. c Representative images (×200; EVOS XL AMEX1000 Core Imaging System) and quantification of scratch motility assays of eRMS and aRMS cells pre-treated with IC50 concentrations of AJ-5 or vehicle for 24 h and then replated at 100% confluency in drug-free medium. After cell adherence, a sterile 2 µL pipette tip was used to make a linear wound in the cell monolayer and cells were treated with 10 µg/mL mitomycin C to inhibit proliferation. Cells were imaged at 0, 3, 6, 9, 12 and 24 h post wound formation. Total area migrated was calculated by subtracting the wound area at each time point from the wound area at time 0 h, which is represented in the graphs as mean area migrated ± SEM pooled from three independent repeats. Data were analysed using GraphPad Prism 6.0 and a parametric unpaired t-test was performed where *p < 0.05, **p < 0.01, ***p < 0.001

