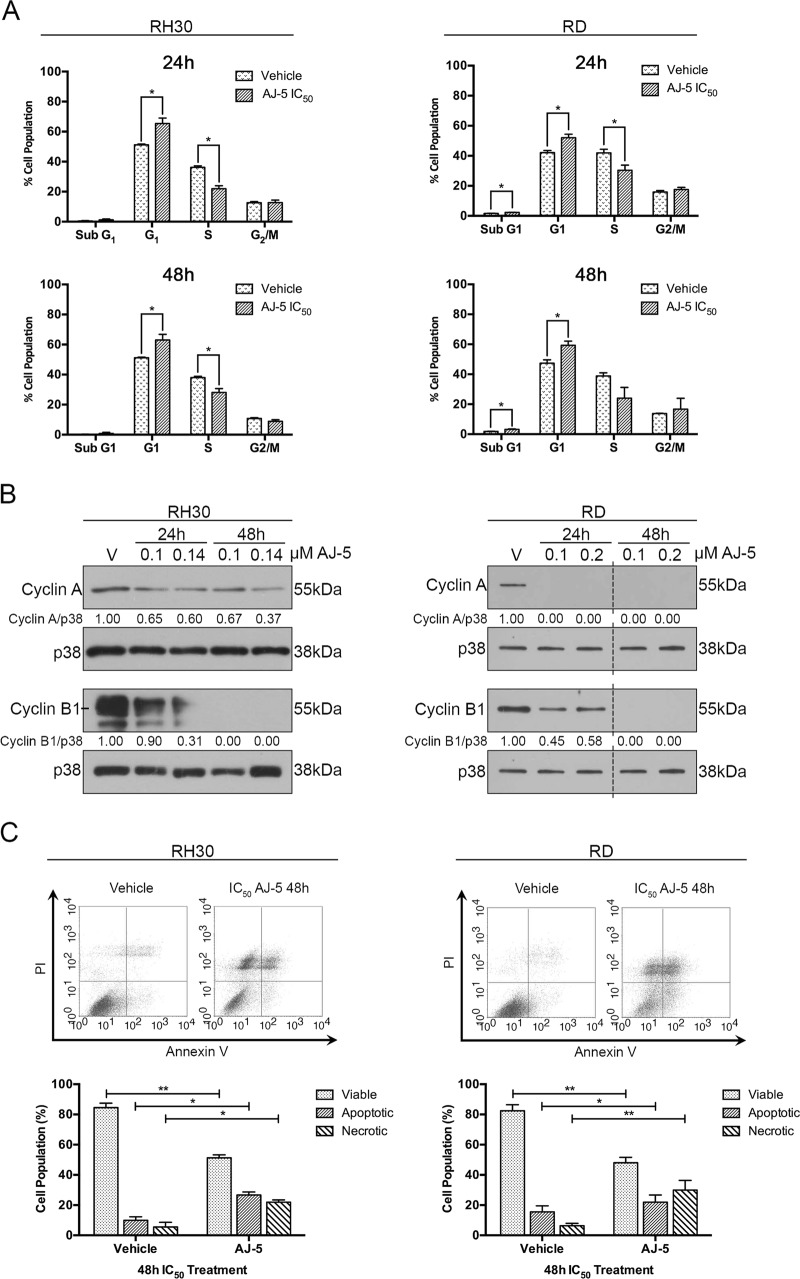
Fig. 4. AJ-5 triggers a G1 cell cycle arrest and induces apoptotic and necrotic cell death in RH30 and RD cells.
a Flow cytometry analyses of cells treated with vehicle or IC50 AJ-5 for 24 and 48 h. Graphs represent the mean proportion of cells ± SEM at each phase of the cell cycle pooled from three independent repeats. b Western blot analyses of protein harvested from cells treated as indicated and incubated with antibodies against cell cycle markers cyclin A and cyclin B1. p38 was used as a loading control. Densitometry readings were obtained using ImageJ and protein expression levels are represented as a ratio of protein of interest/p38 normalized to the vehicle control sample. Blots are representative of at least two independent repeats. Broken lines indicate where lanes not relevant were removed. c Flow cytometric analyses of cells treated with vehicle or IC50 AJ-5 and stained with Annexin V-FITC and PI. Graphs represent the mean ± SEM percentage of viable (lower left-hand quadrant), apoptotic (lower right-hand quadrant + upper right-hand quadrant) and necrotic (upper left-hand quadrant) cells from three independent experiments. For a and c data were analysed using GraphPad Prism 6.0 and a parametric unpaired t-test was performed where *p < 0.05, **p < 0.01, ***p < 0.001

