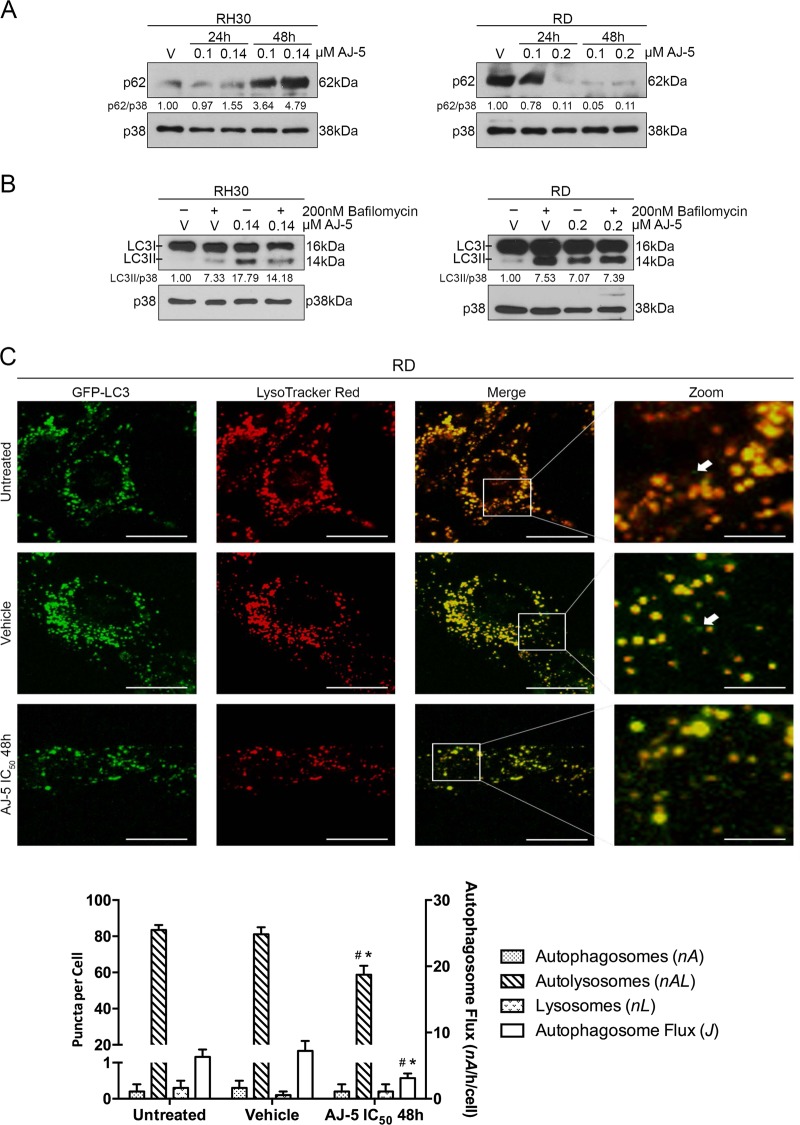
Fig. 6. AJ-5 reduces autophagic flux in RD and RH30 cells.
a Western blotting of p62/SQSTM1 protein levels in RH30 and RD cells treated with vehicle (V), 0.1 µM or IC50 AJ-5 for 24 and 48 h. b Western blotting showing LC3I and LC3II protein levels in RH30 and RD cells treated with vehicle (V) or IC50 AJ-5 for 24 h followed by 2 h of treatment with 200 nM bafilomycin A1. For western blots, p38 was used as a loading control and densitometry readings were obtained using ImageJ. Protein expression levels are represented as a ratio of protein of interest/p38 normalized to vehicle control sample. Blots are representative of at least two independent repeats. c Representative single-cell fluorescence maximum intensity projection micrographs (×630; Carl Zeiss LSM 780; scale bar is 20 µM) and pool size quantification of autophagy pathway intermediates: autophagosomes (GFP-LC3, nA) (indicated with white arrows in the merged image), autolysosomes (LysoTracker Red, nAL) and lysosomes (merged, nL). Autophagosome flux J was calcuclated. Data were analysed using GraphPad Prism 6.0 and a parametric unpaired t-test was performed *p < 0.05, **p < 0.01, ***p < 0.001. # compared to untreated control, * compared to vehicle control

