Fig. 3.
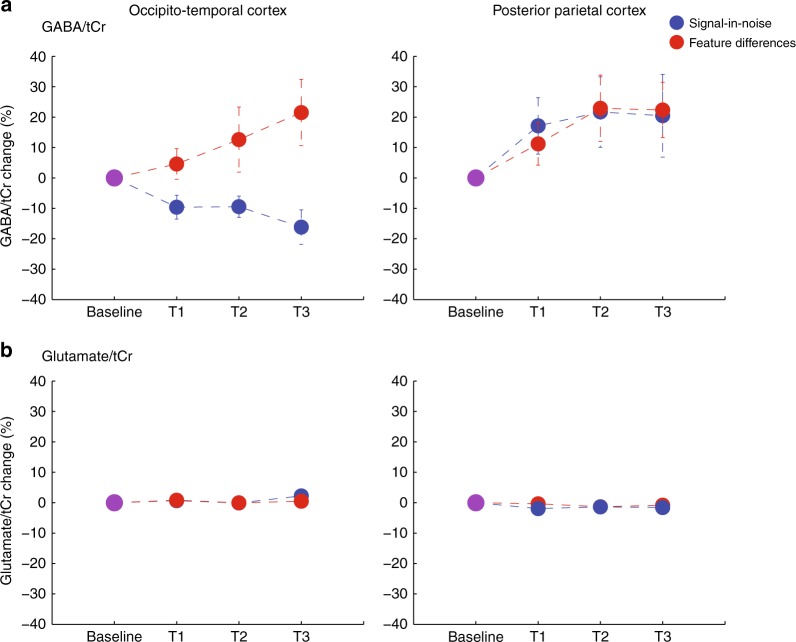
MR spectroscopy (MRS) measurements of γ-aminobutyric acid (GABA) and glutamate during training. a MRS-measured GABA over time is shown from two voxels (occipito-temporal, posterior parietal cortex) per task (signal-in-noise, feature differences). For each MRS voxel, we calculated % GABA change: we normalized GABA/tCr per training block (T1, T2, T3) to GABA/tCr recorded during the baseline block; that is, we computed GABA/tCr change subtracting GABA/tCr measurements in each of the three training blocks from the baseline block and then divided by GABA/tCr in the baseline block. We observed maximum (across blocks) 20% GABA change (mean across participants). This is consistent with previous studies measuring GABA at 3T that have reported changes in GABA between 10 and 15% within a single session (duration of 20–30 min) of stimulation75 or training13. Ultra-high field imaging (i.e., 7T) has been shown to have increased sensitivity for MR spectroscopy measurements19,20 and may result in enhanced and more accurate detection of learning-dependent changes in GABA. b MRS-measured glutamate over time is shown from two voxels (occipito-temporal, posterior parietal cortex) per task (signal-in-noise, feature differences). For each MRS voxel, we calculated % glutamate change: we normalized glutamate/tCr per training block (T1, T2, T3) to glutamate/tCr recorded during the baseline block; that is, we computed glutamate/tCr change subtracting glutamate/tCr measurements in each of the three training blocks from the baseline block and then divided by glutamate/tCr in the baseline block. Error bars indicate standard error of the mean across participants. Error bars are not visible for small changes in metabolite concentrations

