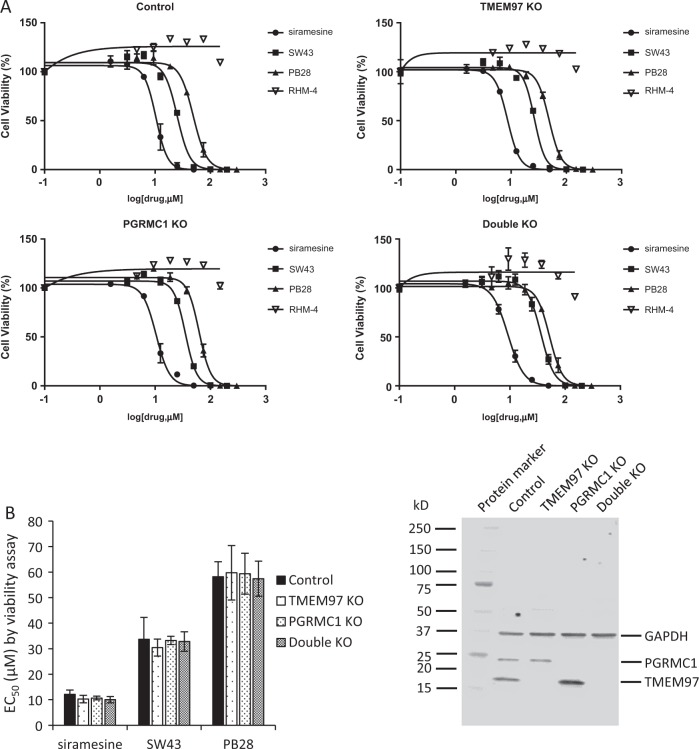
Fig. 2. Cytotoxicity of sigma-2 ligands determined by cell viability assay.
Control, TMEM97 KO, PGRMC1 KO, or double KO cells were treated with increasing concentrations of sigma-2 ligands for 24 h. The cell viability was then determined by CellTiter Glo® chemiluminescent assay. a Representative dose–response curves of cell viability for the control and knockout cell lines. b EC50 values of sigma-2 ligands were represented as bar graphs. EC50 values were reported as mean ± SD from at least two independent experiments performed in triplicates. No significant difference existed for EC50 values of sigma-2 ligands in TMEM97 KO, PGRMC1 KO, or double KO cells vs control cells by 2-way Anova analysis. c Representative western blot analysis for TMEM97 and PGRMC1 in the control and knockout cell lines used in the current study

