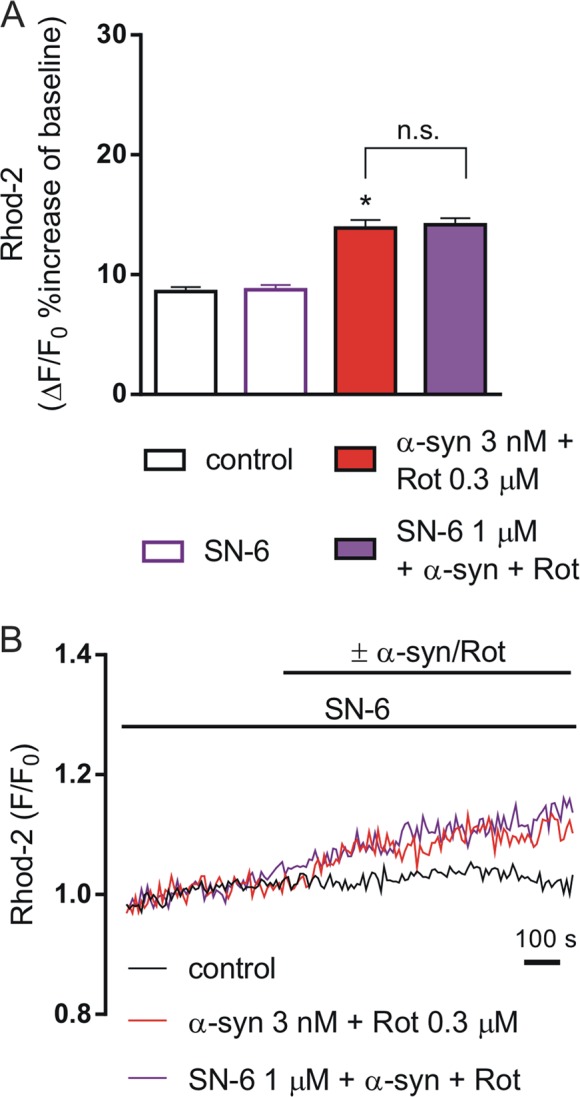
Fig. 5. Effect of SN-6 on mitochondrial Ca2+ levels in SH-SY5Y differentiated cells exposed to α-synuclein (α-syn) and rotenone (Rot).

a Histogram showing mitochondrial Ca2+ levels expressed as Δ% fluorescence increases under resting conditions (open bars) and during 3 nM α-syn + 0.3 µM Rot applied alone or in combination with 1 µM SN-6 (filled bars). For each experimental group, Δ% values used for the statistical analysis derived from 4 independent experiments and 50–100 cells were recorded in each different session (*P < 0.0001 α-syn+Rot vs control and control+SN-6; the α-syn+Rot group was not significantly different from α-syn+Rot+SN-6 group). b Representative recordings of mitochondrial Ca2+ responses in control conditions (black line), in the presence of α-syn plus Rot (green line) co-applied with 3 µM of SN-6 (violet line)
