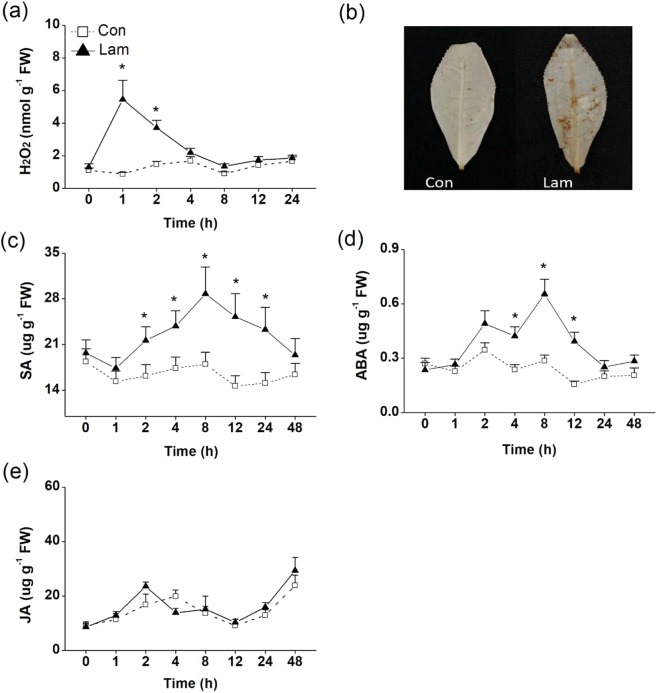
Figure 2.
Mean levels of different defense-related signal molecules in tea plants. The level of H2O2 (a), SA (c), ABA (d) and JA (e) contents in control (Con) and laminarin-treated sets (Lam) were analyzed at different time intervals. (b) DAB staining analysis of H2O2 level in tea leaves treated with laminarin (Lam) or control (Con). The values represent means + standard error (SE) of five repeats. Asterisks indicate the significant differences between treatments and controls at each time point (*P < 0.05; **P < 0.01; Student’s t-test).

