Fig. 3.
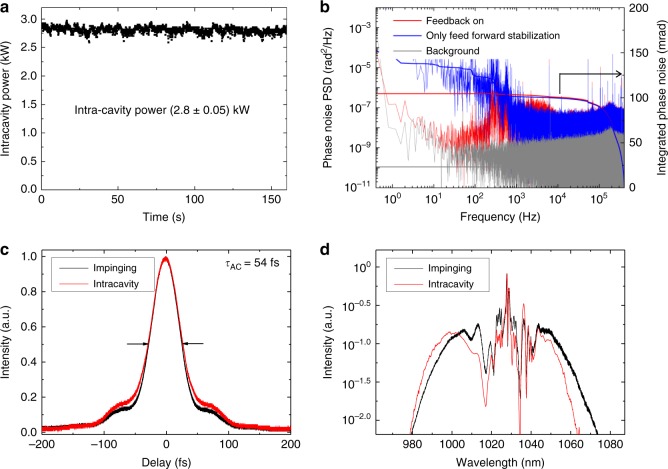
Laser system and intra-cavity specifications. a Measurement of the nonlinear intracavity power over a duration of 160 s, under experimental conditions for optimised HHG generation. The root-mean-square intensity fluctuations amounts to 1.8%. b Phase noise measurement of the MOPA output. Feed-forward phase stabilisation of the pulse train before the CPA36 results in an phase noise <150 mrad integrated in the band of 0.4 Hz–400 kHz (blue). Employing a feed-back loop for phase noise compensation after the CPA and nonlinear compression reduces the integrated phase noise to ~100 mrad (red). However, this additional stabilisation was not used in the PES experiments, as it did not improve the PES statistics. c Autocorrelation traces of the impinging pulses (black) and the pulses circulating in the EC with an argon target (red). In the case of the argon target, a slight temporal broadening is observed, which can be attributed to the nonlinear interaction of the circulating pulse with the gas target. The measured full-width-at-half-maximum of the autocorrelation trace (τAC = 54 fs) indicates a sub-40-fs duration for both pulses. d Spectra of the fundamental light impinging the EC (black) and the circulating light with an argon target (red). The blueshift typical to intra-cavity HHG38 can be observed

