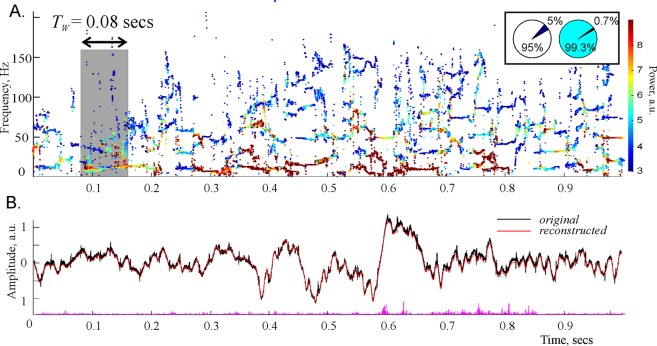
Figure 1.
Padé spectrograms of the hippocampal LFP signal. (A) Discrete Padé Spectrogram (DPS) produced for the LFP signal recorded in the CA1 region of the rodent hippocampus at the sampling rate 10 kHz. At each moment of time, the vertical cross section of the spectrogram gives the instantaneous set of the regular frequencies. At consecutive moments of time, these frequencies produce distinct, contiguous traces, which can be regarded as timelines of discrete oscillatory processes—the spectral waves with varying frequencies ωq(t), amplitudes Aq(t) (shown by the color of dots) and phases ψq(t) (not shown). Note that the higher frequency spectral waves tend to have lower amplitudes. Highest amplitudes appear in the θ-region, i.e. in the frequency range between 4 and 12 Hz. The spectral waves above 100 Hz tend to be scarce and discontinuous, representing time-localized splashes of LFP. The width of the time window is TW = 0.08 sec (800 data points). The pie diagrams in the box show that stable harmonics constitute only 5% of their total number, but carry over 99% of the signal’s power. (B) The LFP signal reconstructed from the regular poles (red trace) closely matches the original signal (black trace) over its entire length, which demonstrates that the oscillon decomposition (2) provides an accurate representation of the signal. The difference between the original and the reconstructed signal is due to the removed noise component—the discarded “irregular” harmonics (the magenta “grass” along the x-axis). Although their number is large (about 90–99% of the total number of frequencies), their combined contribution is small—only about 10−3–10−4% of the signals power.

