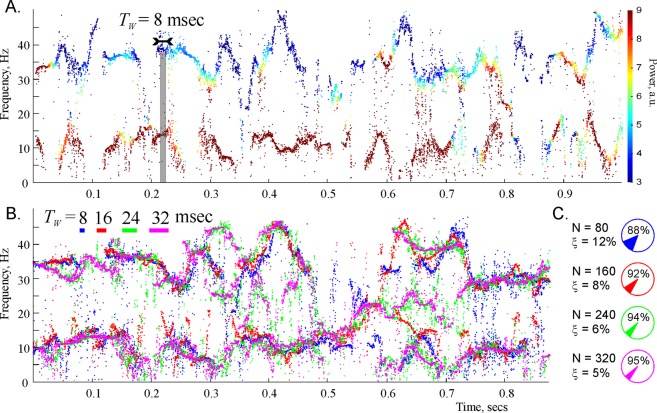
Figure 2.
Spectral waves. (A) A detailed representation of the lower portion the spectrogram recomputed for TW = 0.08 sec (80 data points) exhibits clear oscillatory patterns. (B) The shape of the two lowest frequency spectral waves is stable with respect to the variation of time window size, TW. The strikes of different color in the top left corner represent the widths of the four TW-values used in DPT analysis. The corresponding reconstructed frequencies are shown by the dots of the same color. Although the frequencies obtained for different TWs do not match each other exactly, they outline approximately the same shape, which, we hypothesize, reflects the physical pattern of synchronized neuronal activity that produced the analyzed LFP signal. (C) Pie diagrams illustrate the numbers of data points N = 80, N = 160, N = 240, N = 320 and the mean numbers of the regular and the irregular (noisy) harmonics in each case.

