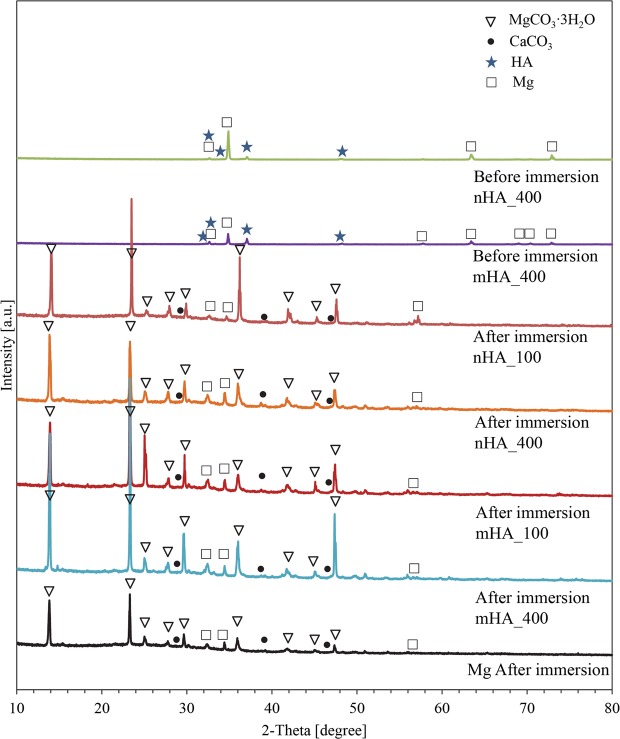
Figure 12.
XRD spectra of degradation products on the surface of nHA_100, nHA_400, mHA_100, and mHA_400 coated Mg rods, as well as non-coated Mg rod control after immersion in rSBF for 6 weeks. XRD spetra of the representative nHA and mHA coatings before immersion were included for comparison. The XRD spectra are for the samples of nHA_400 and mHA_400 before immersion, and nHA_100, nHA_400, mHA_100, mHA_400 and Mg control after immersion. Mg rod samples had an initial dimension of 7.5 mm in diameter and 15 mm in height. Phases were identified based on MgCO3∙3H2O (ICSD pattern 00-020-0669), CaCO3 (ICSD pattern 01-086-0174), HA (ICSD pattern 00-001-1008) and Mg (ICSD pattern 01-079-6692).

