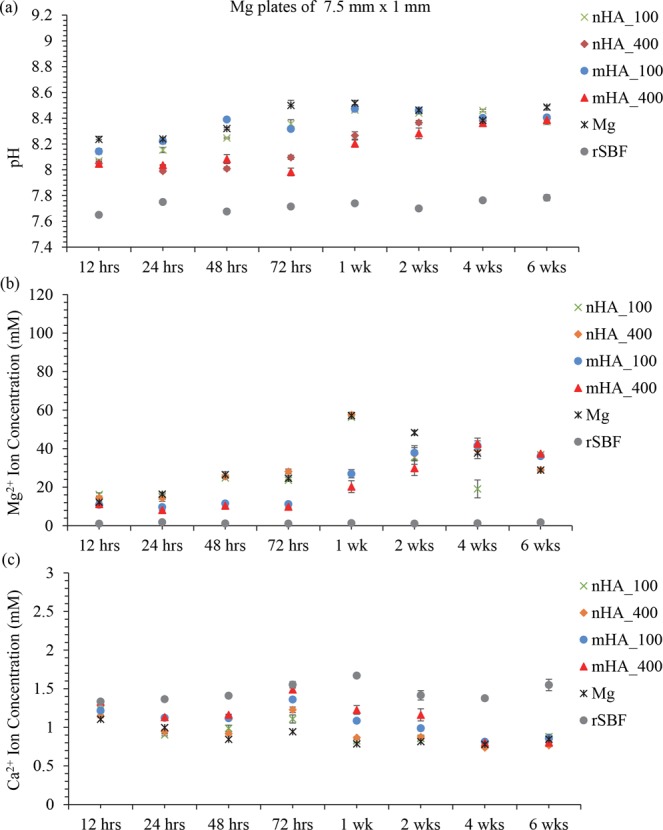
Figure 15.

Post-culture media analyses at each prescribed time point after immersion of nHA_100, nHA_400, mHA_100, and mHA_400 coated Mg plates, non-coated Mg plate control in rSBF, and rSBF control for 6 weeks. Mg plate samples had a dimension of 7.5 mm in diameter and 1 mm in thickness. (a) The pH of the collected rSBF after cultured with each sample at each prescribed time point. (b) The Mg2+ ion concentration in the collected rSBF after cultured with each sample at each prescribed time point. (c) The Ca2+ ion concentration in the collected rSBF after cultured with each sample at each prescribed time point. Data are mean ± standard error (N = 3).
