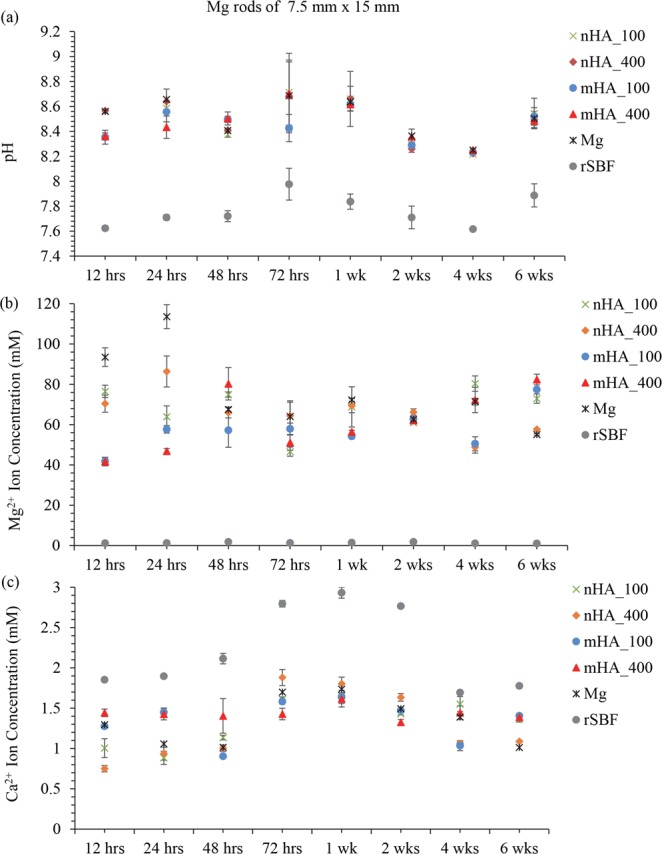
Figure 16.

Post-culture media analyses at each prescribed time point after immersion of nHA_100, nHA_400, mHA_100, and mHA_400 coated Mg rods, non-coated Mg rod control in rSBF, and rSBF control for 6 weeks. Mg rod samples had a dimension of 7.5 mm in diameter and 15 mm in height. (a) The pH of the collected rSBF after cultured with each sample at each prescribed time point. (b) The Mg2+ ion concentration in the collected rSBF after cultured with each sample at each prescribed time point. (c) The Ca2+ ion concentration in the collected rSBF after cultured with each sample at each prescribed time point. Data are mean ± standard error (N = 3).
