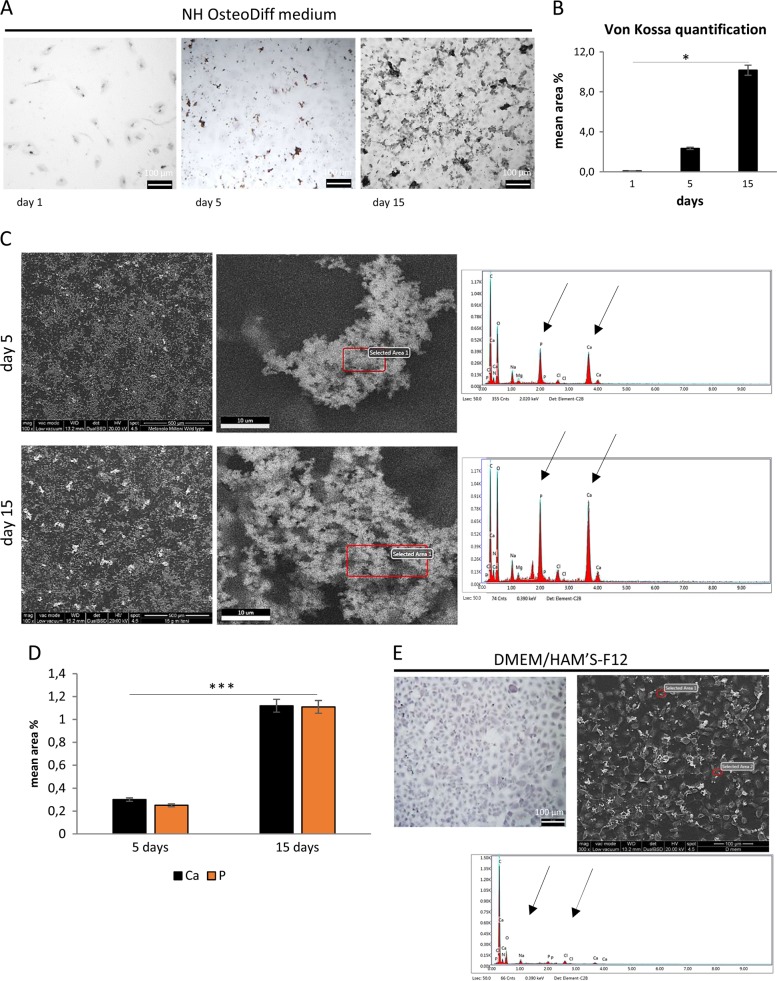
Fig. 2. Calcium phosphate deposition is detected in HK-2 cell aggregates in osteogenic medium.
a von Kossa staining images of cells cultured in NH OsteoDiff medium. Images are representative of three separate experiments. b Quantitative analysis of von Kossa staining performed using morphometric analysis on the pooled results of three separate experiments, and the values represent the means ± SD. *p < 0.05. c ESEM images and spectra of selected areas of cells cultured in NH OsteoDiff medium for 5 and 15 days. The images are representative of three separate experiments. Bar = 500 μm left and 10 μm right. d Semi-quantitative measure of the composition of the inclusions, based on three separate experiments, the values representing the means ± SD. ***p < 0.005. Ca = Calcium, P = Phosphate. e von Kossa staining (left) and ESEM image with representative spectrum of selected areas (right) of cells cultured. DMEM/HAM’S-F12 supplemented with 10% HI-FBS (day 15)

