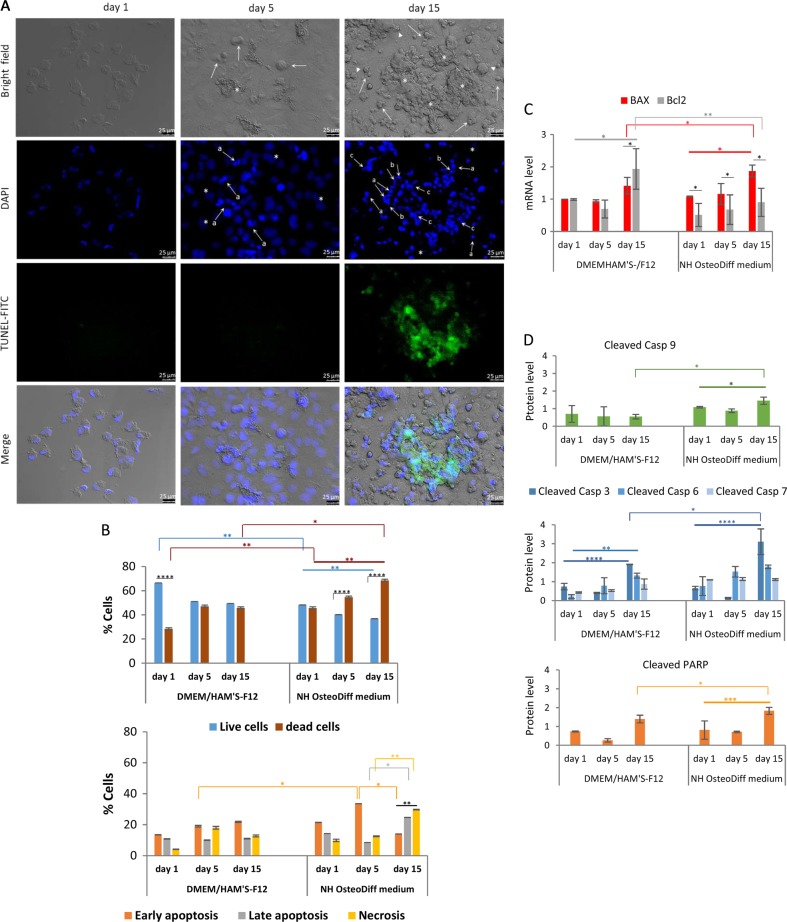
Fig. 3. HK-2 cells in osteogenic medium show caspase-dependent apoptosis localized in cellular aggregates.
a Representative bright field and immunofluorescence images of DAPI and TUNEL-stained apoptotic nuclei of HK-2 cells grown in NH OsteoDiff medium for 1, 5, and 15 days. In the bright field image, arrows indicate small, highly refringent circular cells with condensed cytoplasm, asterisks indicate cell aggregates or nodules, and arrowheads show examples of membrane blebbing. In the DAPI images, apoptotic nuclei are brightly blue fluoresced by comparison with normal nuclei (asterisks). Arrows point to examples of: a apoptotic bodies of nuclear condensation; b chromatin marginalization; and c fragmentation. FITC-TUNEL images show DNA fragmentation localized in the nodule (Merge). The images are representative of three experiments. Bar = 25 μm. b Quantification of dead cells by double staining of HK-2 cells with annexin V and PI, for 1, 5 and 15 days: live versus dead cells (up); and early or late apoptotic and necrotic cells (down). Dead cells = early + late apoptotic cells + necrotic cells. Data are presented as the mean ± SD of three separate experiments. **p < 0.001; ***p < 0.005; ****p < 0.0001. c qRT/PCR of BAX and BCL2 apoptosis-related genes, for 1, 5, and 15 days. Data are presented as the mean ± SD of three separate experiments. *p < 0.05; **p < 0.001. d Quantification of initiator caspase-9, effector caspases -3, -6 and -7, and PARP substrate by in-cell Western assay, for 1, 5, and 15 days. Data are presented as the mean ± SD of three separate experiments. *p < 0.05; **p < 0.001; ***p < 0.005; ****p < 0.0001

