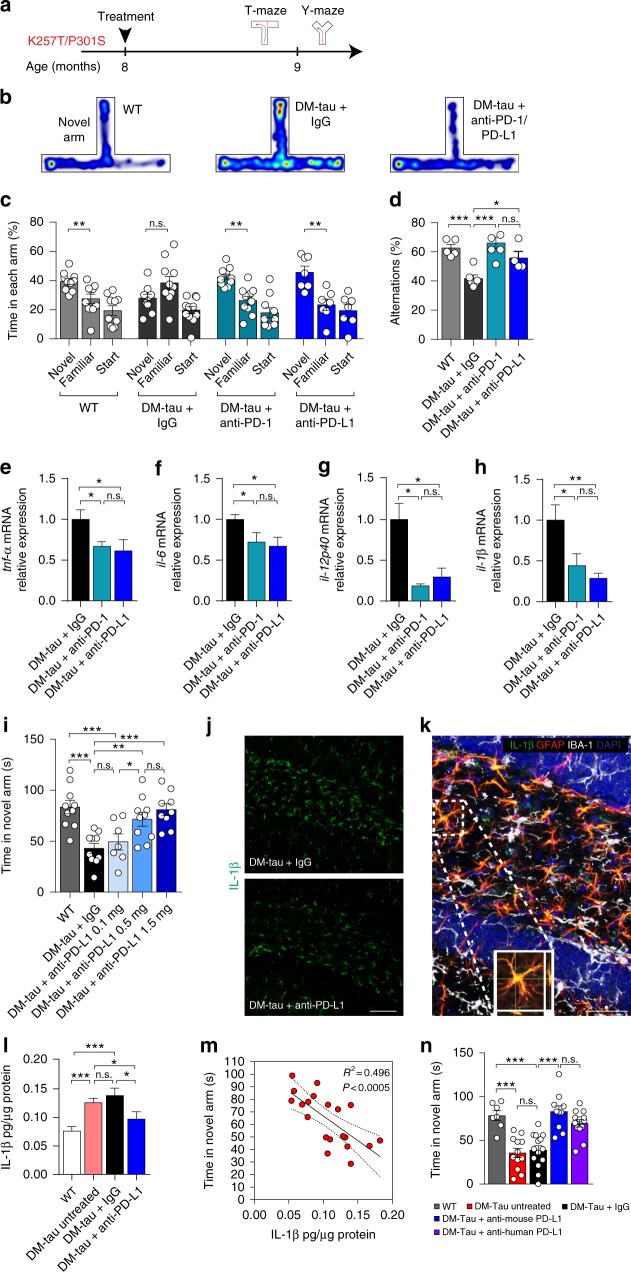
Fig. 3.
Blockade of the PD-1/PD-L1 axis in DM-hTAU mice reduces cognitive deficits and cerebral pathology. DM-hTAU mice (8-month-old) were treated with anti-PD antibody, anti-PD-L1 antibody, or IgG control antibody (0.5 mg/mouse); experimental design is presented in a. b Representative heat-map plots of the time spent in the distinct arms, by the three tested groups. c Effect of anti-PD-1/PD-L1 antibodies on performance in T-maze. DM-hTAU mice treated with anti-PD-1 antibody (n = 10) or anti-PD-L1 antibody (n = 7) exhibited increased novel arm preference, compared to IgG controls (n = 11); age-matched WT littermates (n = 10) were also tested. d Y-maze performance of male DM-hTAU mice treated with anti-PD-1 antibody (n = 6), anti-PD-L1 antibody (n = 4), or IgG isotype control (n = 6), and age-matched WT (n = 5). e–h Hippocampi were isolated from one hemisphere of the brains of the animals in d for quantitative RT-qPCR; IgG control (n = 6), anti-PD-1 antibody (n = 6), or anti-PD-L1antibody (n = 4) (one-way ANOVA and Fisher exact test). i Dose-dependent effect of anti-PD-L1 antibody on T-maze performance of DM-hTAU mice (male and female; 9-month-old) (0.1 mg/mouse (n = 7), 0.5 mg/mouse (n = 10), or 1.5 mg/mouse (n = 9), and IgG control at 1.5 mg/mouse (n = 10)), WT (n = 10). Results are expressed as the time spent in the novel arm (one-way ANOVA and Fisher’s exact test). j Representative images of IL-1β immunoreactivity in mice treated with anti-PD-L1 antibody or with IgG control. k Representative orthogonal projection of confocal z-axis stacks, showing colocalization of IL-1β (green) with GFAP+ astrocytes (red), but not with IBA-1+ microglia/macrophages (white), in the dentate gyrus. Cell nuclei (DAPI, blue). Scale bar, 100 μm. l Immunoassay of hippocampal IL-1β protein levels in untreated mice (n = 3), mice treated with anti-PD-L1 antibody (n = 6) or IgG (n = 6) and WT littermates (n = 6), normalized to mg protein in each homogenate. m Correlation between cognitive performance in the T-maze, shown in Supplementary Fig. 7, and IL-1β protein levels for all groups. n T-maze of DM-hTAU mice (9-month-old, male and female) treated with either 1.5 mg of anti-mouse PD-L1 antibody (n = 11), or with anti-human PD-L1 antibody (n = 13), 1.5 mg/mouse of IgG control (n = 14), and compared to untreated DM-hTAU mice (n = 12) and WT littermates (n = 7). One-way ANOVA and Fisher exact test. In all panels, error bars represent mean ± s.e.m.; *P < 0.05, **P < 0.01, ***P < 0.001

