Fig. 7.
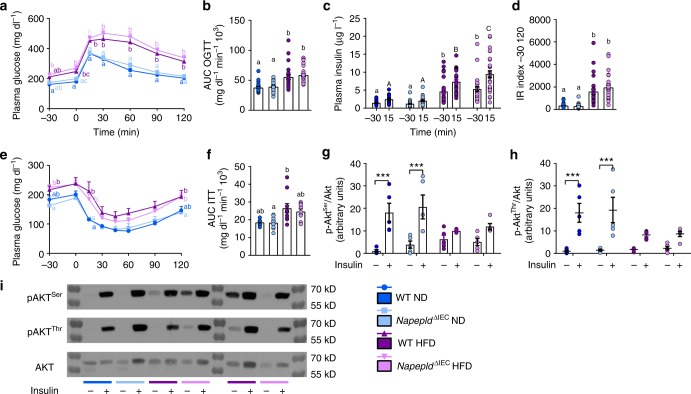
IEC-specific Napepld deletion does not affect glucose homeostasis. a Plasma glucose profile (mg dl−1) measured between 30 min before and 120 min after glucose loading (n = 26–28). b Mean area under the curve (AUC, mg dl−1 min−1 103) measured between 30 min before and 120 min after glucose loading (n = 26–28). c Plasma insulin levels (µg l−1) at 30 min before and 15 min after glucose loading (n = 26–28). d Insulin resistance index determined by multiplying the AUC of blood glucose by the AUC of insulin (n = 26–28). e Plasma glucose profile (mg dl−1) measured between 30 min before and 120 min after insulin injection. f Mean area under the curve (AUC, mg dl−1 min−1 103) measured between 30 min before and 120 min after insulin injection (n = 5–11). g, h Ratio of the vehicle- and insulin-stimulated g p-Akt ser473 and h p-Aktthr308 on total Akt measured by densitometry. i Representative western-blot for hepatic p-Aktthr308, p-Aktser473, and Akt with or without insulin stimulation (n = 9–11). Dark blue: WT ND mice, light blue: Napepld∆IEC ND mice, purple: WT HFD mice and pink: Napepld∆IEC HFD mice. Data in a–d correspond to the results of three independent experiments. Data are presented as the mean ± s.e.m. Data with different superscript letters are significantly different (P < 0.05) according to repeated measures two-way ANOVA followed Tukey’s post-hoc test (a, c, e) or regular two-way ANOVA followed by Tukey’s post-hoc test (b, d, f). Asterisk (***) indicates a significant difference versus vehicle-injected group (P < 0.001) according to two-way ANOVA followed by Sidak’s post-hoc test (g, h)

