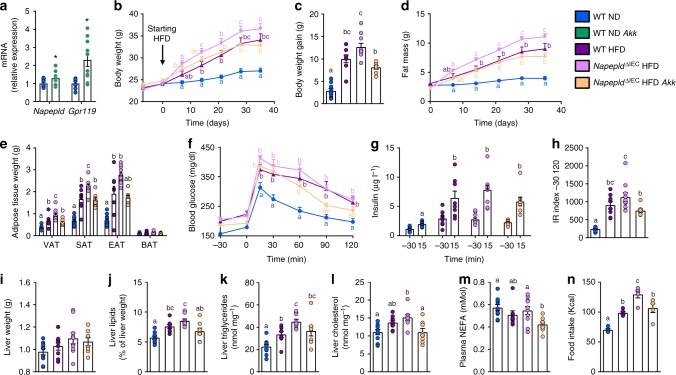
Fig. 9.
Effects of A. muciniphila in HFD-fed Napepld∆IEC mice. a mRNA expression of Napepld and Gpr119 in the ileum of ND-fed mice upon treatment with A. muciniphila. b Body weight (g) over a 5 weeks period. c Body weight gain (g) after 5 weeks. d Fat mass (g) over a 5 weeks period. e Weight of different white adipose tissue depots and BAT (g). f Plasma glucose profile (mg dl−1) measured between 30 min before and 120 min after glucose loading. g Plasma insulin levels (µg l−1) at 30 min before and 15 min after glucose loading. h Insulin resistance index determined by multiplying the AUC of blood glucose by the AUC of insulin. i Liver weight (g). j Liver lipid content (as percentage of liver weight) measured by gravimetry. k) Liver triglycerides (nmol mg−1). l Liver cholesterol (nmol mg−1). m Plasma non-esterified fatty acids (NEFA, mMol). For a–m, n = 8–10. n Food intake during the first week (kcal, n = 5). See also Supplementary Figure 4. Dark blue: WT ND mice, green: WT ND Akk mice, purple: WT HFD mice, pink: Napepld∆IEC HFD mice and orange: Napepld∆IEC HFD Akk mice. Data are presented as the mean + s.e.m. Asterisk (*) indicates a significant difference versus WT ND (P < 0.05) according to Student’s t-test. Data with different superscript letters are significantly different (P < 0.05) according to one-way ANOVA followed by Tukey’s post-hoc test (c, e, h–n) or repeated measures two-way ANOVA followed by Tukey’s post-hoc test (b, d, f, g)

