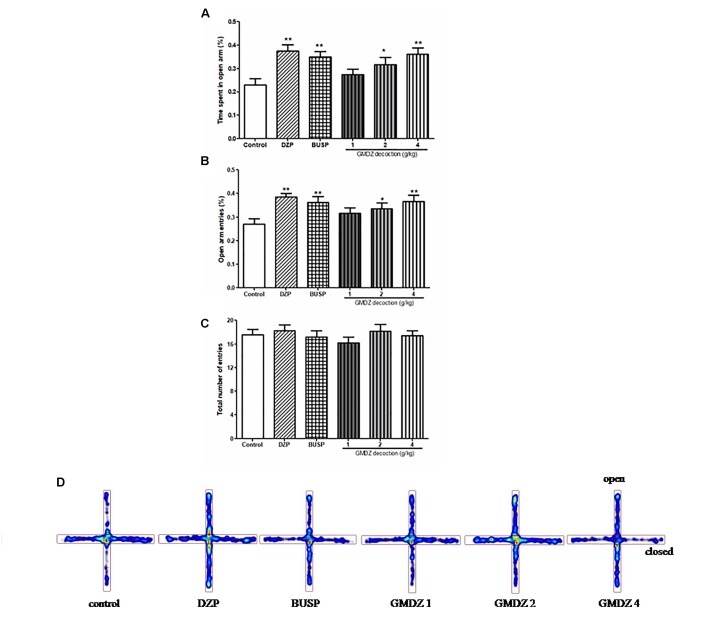
FIGURE 2.
Effect of GMDZ decoction on the EPM test (A) The percentage of time spent on open arms. (B) The percent of open arms entries. (C) The total arm entries. (D) Representative heat map analysis of one animal in each group. Value are represented as mean ± SEM (n = 12). ∗∗P < 0.01 vs. control group. One way ANOVA with Student–Newman–Keuls post hoc test.

