FIGURE 8.

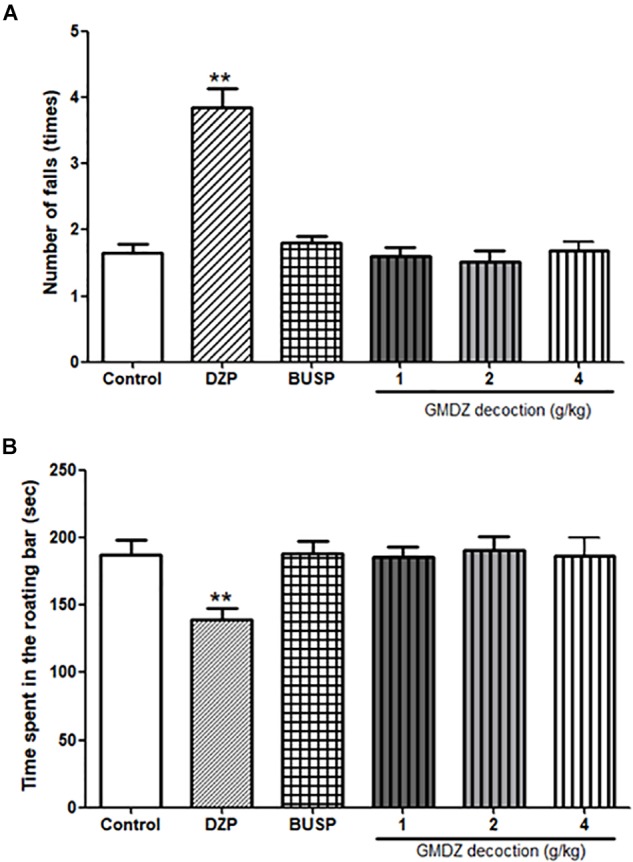
Effect of GMDZ decoction on the rota-rod test. (A) Number of falls. (B) Time spent on the rotating bar. Value are represented mean ± SEM (n = 12). ∗∗P < 0.01 vs. control group. One way ANOVA with Student–Newman–Keuls post hoc test.

Effect of GMDZ decoction on the rota-rod test. (A) Number of falls. (B) Time spent on the rotating bar. Value are represented mean ± SEM (n = 12). ∗∗P < 0.01 vs. control group. One way ANOVA with Student–Newman–Keuls post hoc test.