
Figure 2.
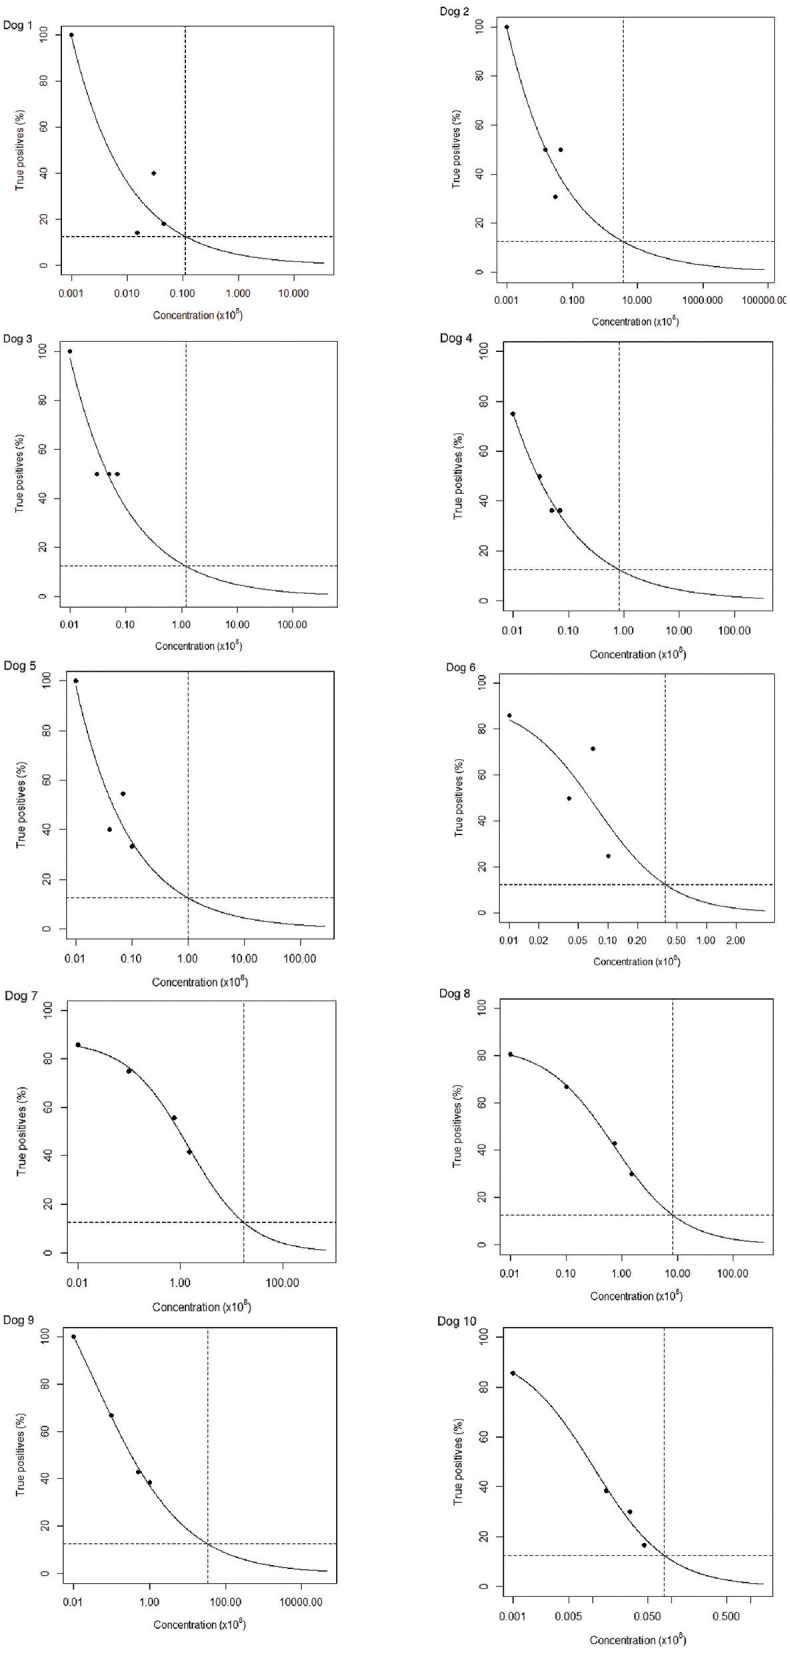
Summary of performance and estimation of thresholds of dogs 1–10 over 12 sessions of olfactory detection thresholds. Graphs show the proportion of true positives at the different concentrations of amyl acetate tested (dots) and an estimation of the global threshold trend (slope). The detection thresholds were estimated as the concentration at which the true positive rate was the equivalent of chance at 12.5% (i.e., the concentration at which the horizontal and vertical dashed lines intersect).