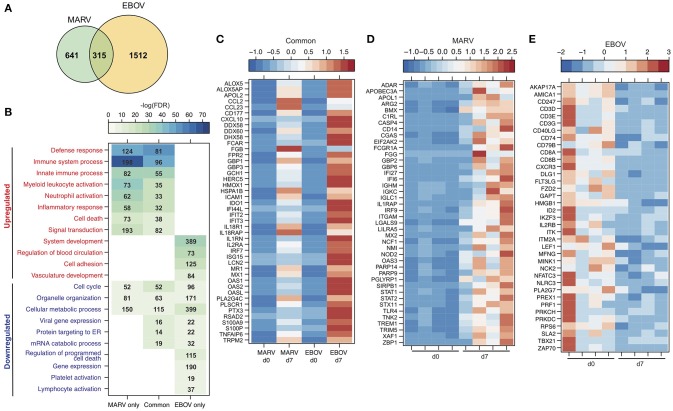
Figure 6.
Transcriptional response to MARV infection indicates lesser disease severity compared to EBOV. (A) Venn diagram displaying overlap between DEGs detected following MARV or EBOV challenge 7 DPC. (B) Heatmap representing functional enrichment of DEGs detected following MARV or EBOV challenge 7 DPC; color intensity represents the statistical significance [shown as –log10 of the false discovery rate (FDR)-corrected p-value]; range of colors is based on the lowest and highest –log10(FDR) values for the entire set of GO processes; the number of DEGs enriching to each GO process each day is listed within each box; blank boxes indicate no significant enrichment to a GO term. (C–E) Heatmap representing gene expression (shown as absolute normalized RPKM values) of DEGs detected 7 DPC: (C) following either MARV or EBOV that enrich to “Defense response” (with a fold change > 11); (D) upregulated DEGs detected only following MARV infection that enrich to “Innate immune response” (with a fold change > 4.0); (E) downregulated DEGs detected only following EBOV infection that enrich to “Lymphocyte activation”. Range of colors is based on scaled and centered RPKM values of the entire set of genes (red represents increased expression while blue represents decreased expression); each column represents the median RPKM values on each day for either group in (C) while each column represents 1 animal in (D,E).

