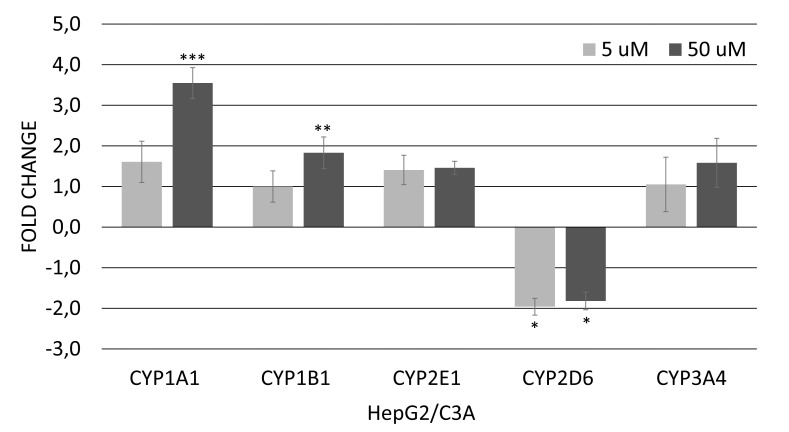
Fig. (2.
A). Relative expression of genes involved in regulation of xenobiotic metabolism in HepG2/C3A cells after 12 hours of exposure to genistein (5 or 50 µM). Values are the mean ± standard deviation of three independent experiments. Asterisks (*) indicate statistically significant differences (p<0.05); (**) indicate statistically significant differences (p<0.01) and (***) indicate statistically significant differences (p<0.001) between the treated genistein groups and the control without genistein group, according to the REST software 2009. Normalized data with GAPDH.

