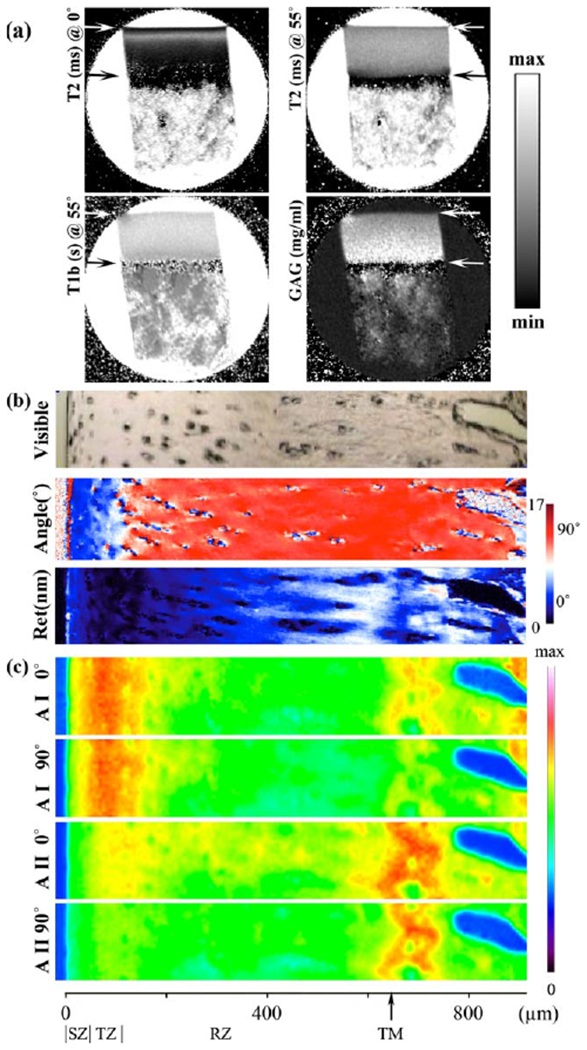
Fig. 2.

a: The 2D images of T2 at 0° and 55° with respect to the magnetic field (vertically up), T1 (at 55°) before soaked in Gd solution, and the GAG concentration. These μMRI images were plotted on a gray scale, with the minimum and maximum intensities set at 0–85 ms for T2 (0°), 0–85 ms for T2 (55°), 0–1.5 s for T1-before, and 0–100 mg/mL for GAG, respectively. The upper arrow marked the boundary between cartilage and saline; the lower arrow marked the boundary between cartilage and bone. b: A visible image of the same specimen in (a) and two calculated PLM images: the angle image (45°–135°) and the retardation image (0–17 nm). c: Four IR absorbance images from the selected area (156 μm by 943 μm) were labeled as AI (amide I) and AII (amide II) at 0° and 90°. The maximum absorbance for all images was 0.668. The horizontal scale indicated the thickness of the cartilage specimen in microns and was divided by the tissue zones. TM stands for the tidemark.
