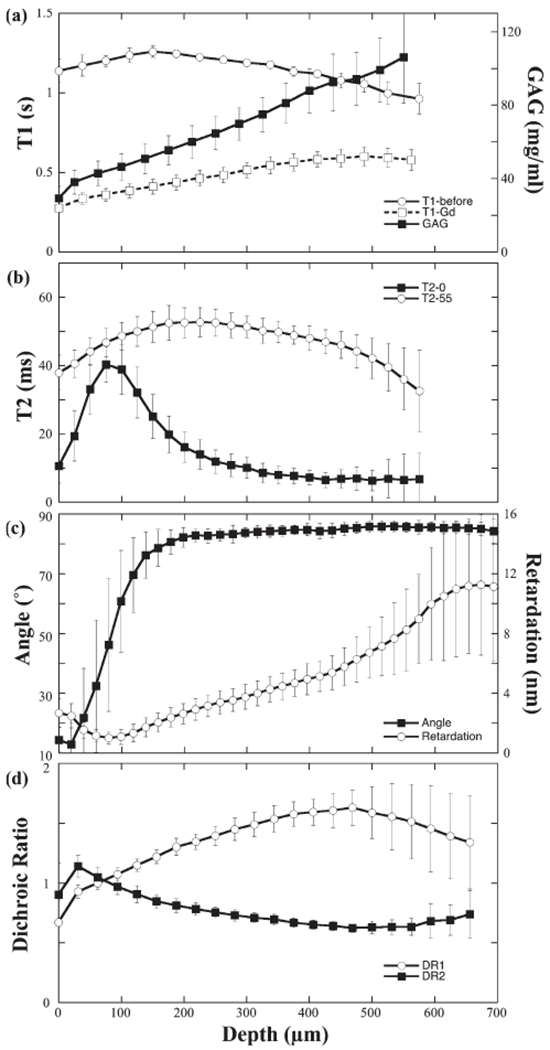
Fig. 3.

a: The averaged T1 profiles before (N = 3) and after (N = 18) the specimens were immersed in the Gd solution, and the calculated GAG profile. b: The averaged T2 profiles (N = 18, only one pixel in every two pixels was plotted) at two specimen orientations: 0° and 55°. c: The averaged profiles of optical retardation (N > 36) and angle (N > 36; only one pixel in every 10 pixels was plotted). d: The averaged dichroic ratio profiles of the amide I and II (N > 36, only one pixel in every five pixels was plotted). Error bars represented SD (standard deviations).
