
Figure 2.
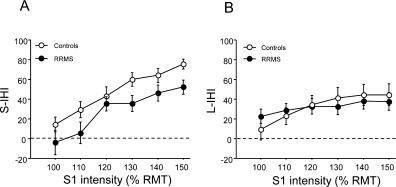
(A) S‐IHI (y‐axis) is given as (1 − conditioned MEP/unconditioned MEP) × 100% and plotted against intensity (in % of the resting motor threshold, RMT) of the conditioning stimulus (x‐axis). All data (white circles: healthy controls; black circles: RRMS patients) are group means ± 1 S.E.M. Note that RRMS patients have a significantly reduced mean S‐IHI intensity curve compared to healthy controls (P = 0.047). (B) In contrast, the mean L‐IHI intensity curve is not different between RRMS patients and healthy controls.