Figure 3.

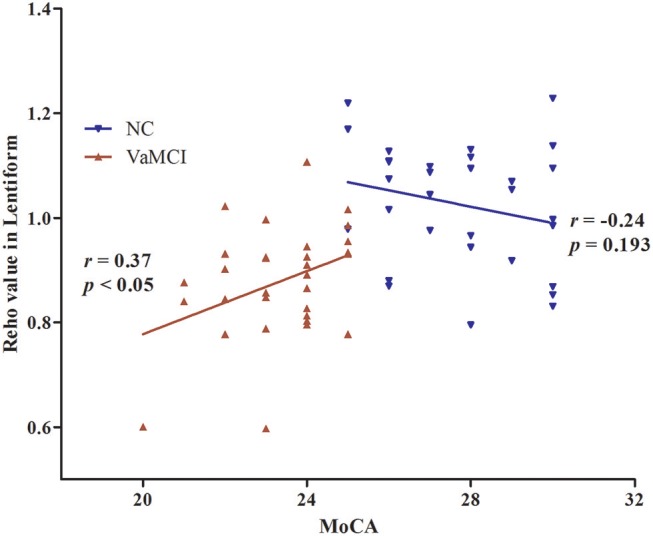
The linear correlation of ReHo values and MoCA scores in the right lentiform nucleus in VaMCI patients (r = 0.37, P < 0.05); red, VaMCI group; blue, NC group.

The linear correlation of ReHo values and MoCA scores in the right lentiform nucleus in VaMCI patients (r = 0.37, P < 0.05); red, VaMCI group; blue, NC group.