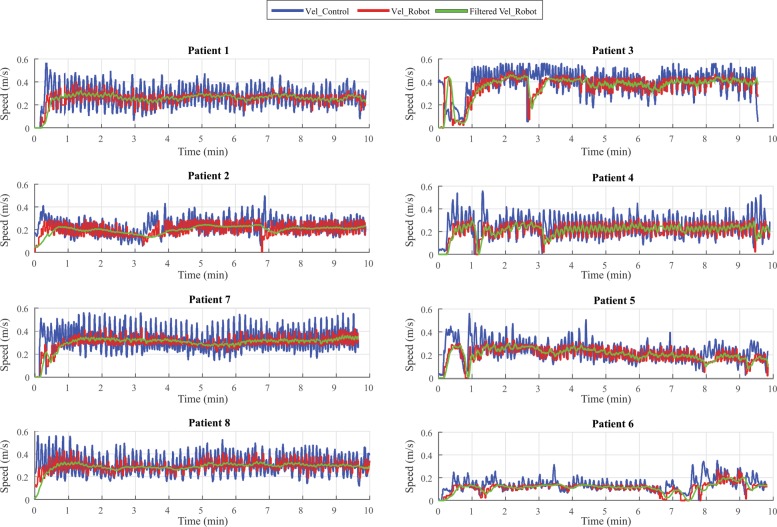
Fig. 3.
Speed behavior in the second stage of the intervention for patients with crutches (Patient 1 and Patient 2), patients with human support during gait (Patient 3, Patient 4, Patient 5 and Patient 6) and patients without any support needed (Patient 7 and Patient 8). The Blue line corresponds to the velocity proposed by the LRF control loop, the Red line corresponds to the velocity executed by the CPWalker and the Green line corresponds to a filtered robot velocity

