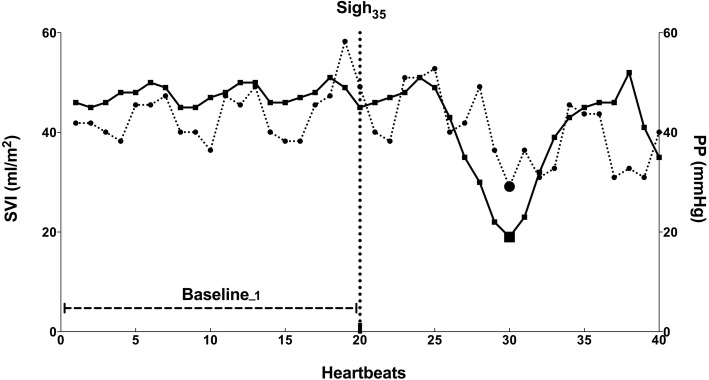
Fig. 1.
Schematic illustration of pulse pressure (PP) and stroke volume index (SVI) variations after Sigh35 in one responder. The solid line with squares indicates PP and the dotted line with circles depicts SVI. Baseline_1 corresponds to the 20 heartbeats preceeding Sigh35, which starts at heartbeat number 20, as indicated by the dotted vertical line. Nadir values of PP and SVI are indicated by the larger square and circle, respectively. Both PP and SVI dropped after application of Sigh35

