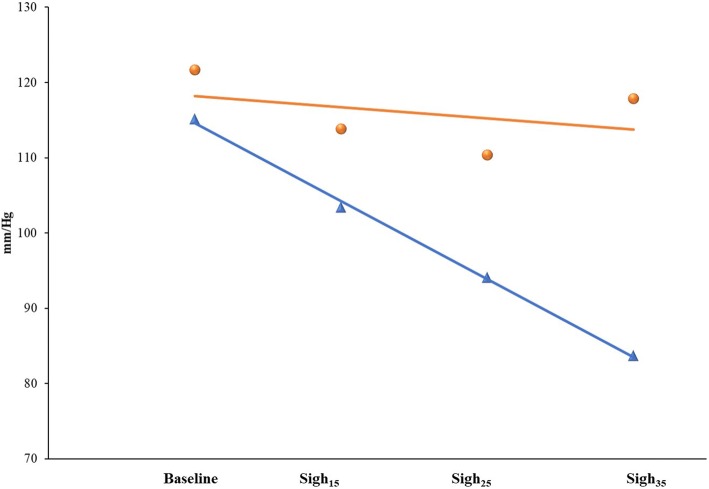
Fig. 2.
Slope calculation of responders (blue line) and non-responders (red line) of systolic arterial pressure (SAP). The blue triangles and the red circles represent the mean values of the two populations (responders and non-responders, respectively) at each step of the protocol. The AUC for the slope of SAP (0.99; sensitivity 100.0% (79.4–100.0%) and specificity 95.8% (78.8–99.9%)) was significantly greater than the AUCs for PP (0.91) and SVI (0.83) (p = 0.04 and 0.009, respectively). The SAP slope best threshold value of the ROC curve was − 4.4° from baseline

