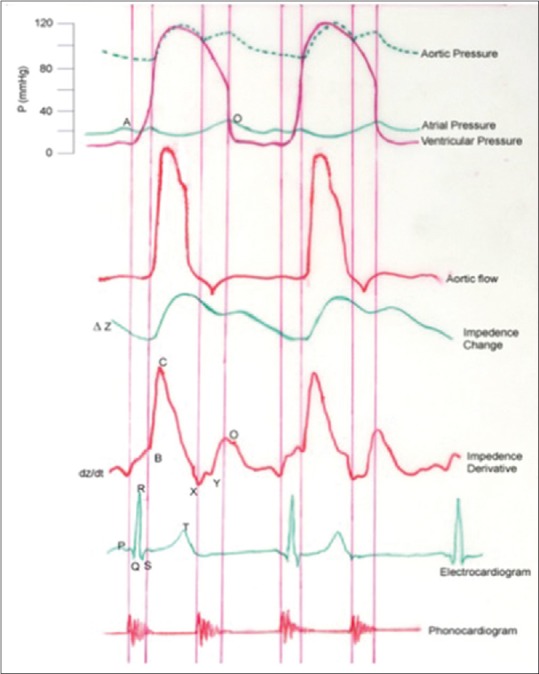
Figure 9.

Variation of ventricular, aortic and atrial pressure, aortic flow, thoracic impedance change, and first derivative of impedance (dZ/dt) as a function of time (t). Electrocardiogram and phonocardiogram taken simultaneously are also shown. The curve depicts the cardiac events/performance. B: Opening of the Aortic Valve, X: Closure of the Aortic Valve, Y: Closure of pulmonary valve, O: Mitral valve opening/rapid ventricular filling, B-X: Ventricular Ejection Time, C: Maximal deflection of dz/dt (Peak Flow), B-C: Slope-Acceleration Contractility Index, A: Atrial Systole, and Q: Start of ventricular depolarization
