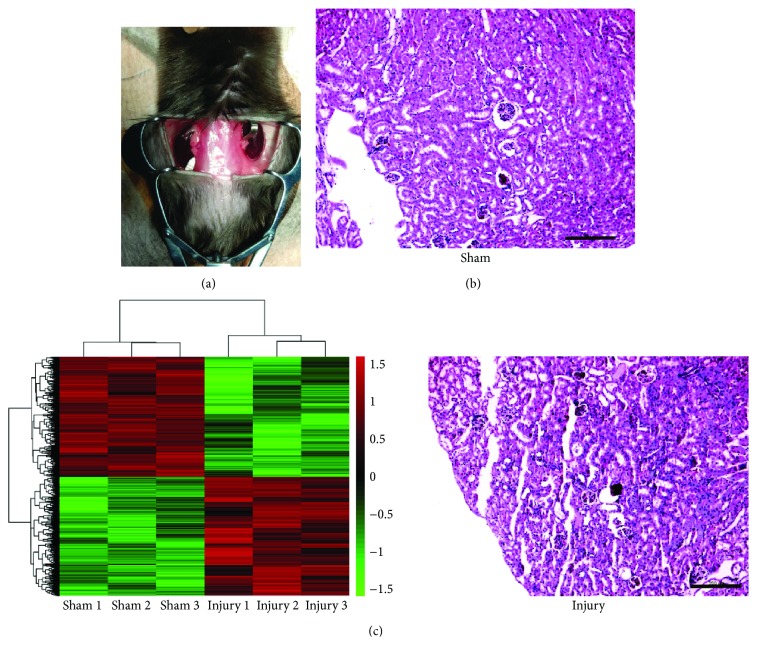
Figure 1.
Screening for the differentially expressed genes in renal IR injury. (a) Representative image of the renal IR injury operation in mice. (b) Pathological changes of the IR injury in the kidneys. The sections were stained with hematoxylin and eosin (H&E), and representative images are shown, scale bars: 200 μm. (c) Heat map diagram of differentially expressed genes from 3 IR-injured mice and 3 sham-operated mice. Red in the color bar shows higher expression and green is lower expression.

