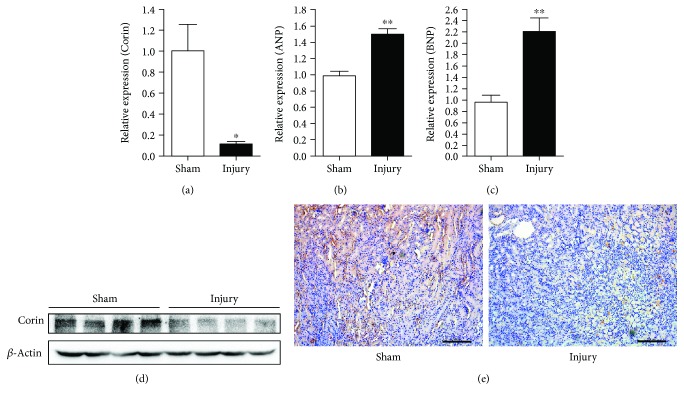
Figure 2.
Renal Corin is downregulated in IR injury. (a-c) The expression of Corin (a), ANP (b), and BNP (c) was measured using a real-time qPCR assay. GAPDH was used as an internal control, and the data are normalized using a 2-ΔΔCt assay. Data are expressed as mean ± SEM, ∗ P < 0.05 and ∗∗ P < 0.01 vs. the sham-operated group. (d) The protein level of Corin was detected by western blotting. β-Actin was employed as an internal control, n = 4 per group. (e) Immunohistochemistry staining against Corin was performed in kidney tissues. Representative images are shown, scale bars: 200 μm.

