
Fig. 1. Effect of 2 and 5 days of inhibition of apoptosis on apoptotic activity.
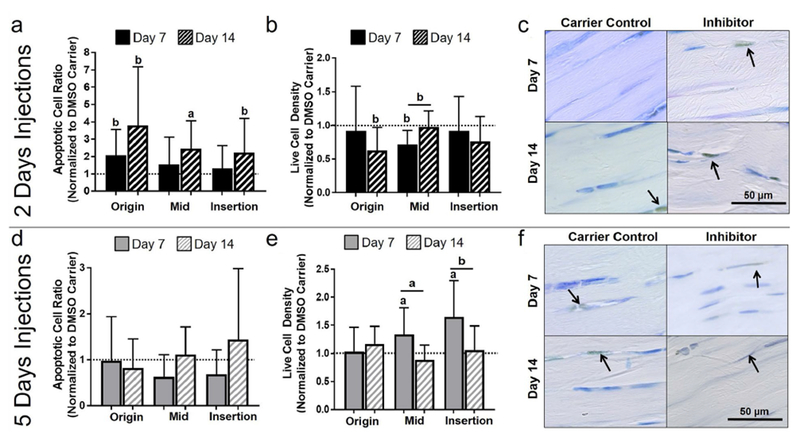
With 2 d of injections, (a) there was a general increase in apoptotic cell ratio at day 14 and (b) a decrease in live cell density at days 7 and 14. (c) Representative midsubstance images of cleaved caspase-3 for 2 d of injection at day 7 and 14, showing increased apoptotic (brown) cells for the apoptosis inhibitor at day 14. With 5 d of injection, (d) there was no changes in apoptotic cell ratio, however, (e) a general increase in live cell density at day 7 was observed. (f) Representative midsubstance images of cleaved caspase-3 for 5 d of injection at day 7 and 14, showing increased live (blue) cells for the apoptosis inhibitor at day 7. Arrows show positive staining.