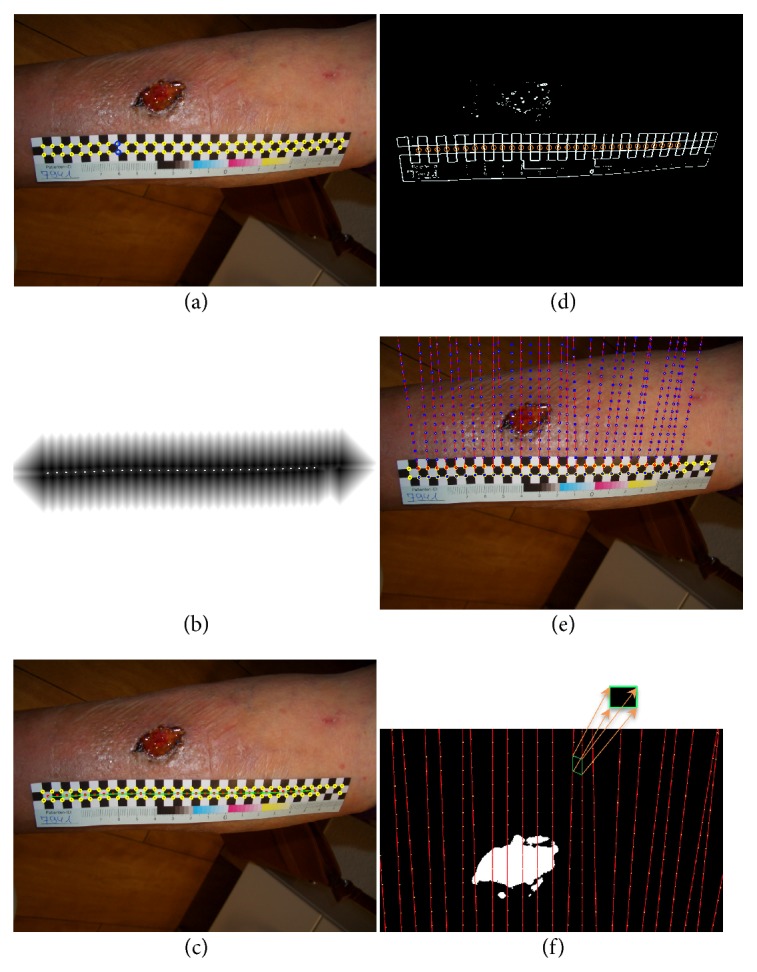
Figure 3.

(a) Identified checkboard points and two corresponding corner points p1 and p2 shown with blue circles. (b) The result of applying DT filter on the corner points. The white dots show the computed local maxima. (c) The fitted curve to the local maxima of the distance transform point result (cline). (d) The red circle windows are applied at the location of each detected intensity change in the high eigenvalue image. (e) Creating a grid pattern by extrapolating each pair of corresponding points over the wound. (f) Each quadrilateral in the grid is unwarped to a square with known size.
