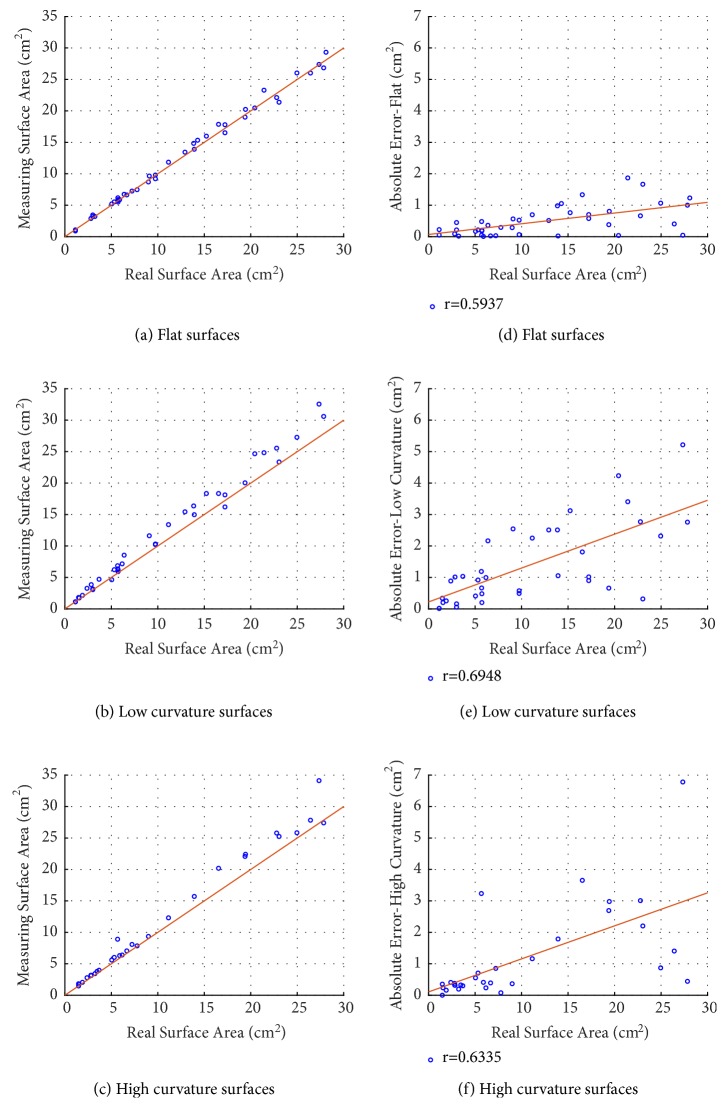
Figure 8.
Comparison between the real surface area and the measured surface area for flat (a), low curvature (b), and high curvature (c) surfaces (lines represent identities). Computed absolute error for the real surface area and the measuring surface area for flat (d), low curvature (e), and high curvature (f) surfaces (lines represent regression lines).

